Ignition VP
Data Management
Introduction
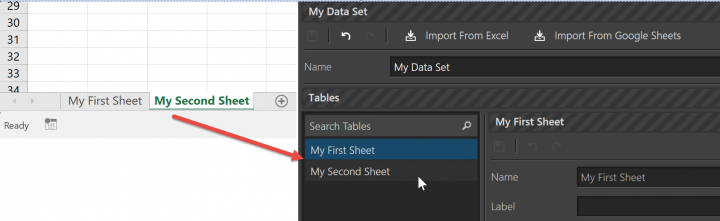
Data is grouped by Data Set. A Data Set is designed to be associated with one Excel spreadsheet or Google Sheet. A Data Set contains multiple Tables, which correspond to individual sheets (tabs) within Excel file / Google Sheet.
All existing Data Sets are shown in the list on the left hand side of the screen. To create a new Data Set, click the relevant button at the top of the list, see 'Create from Excel', or 'Create From Google Sheets' sections below.
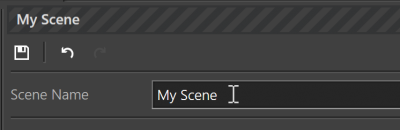
Once you’ve created a Data Set, you can re-name it from the central editor panel:
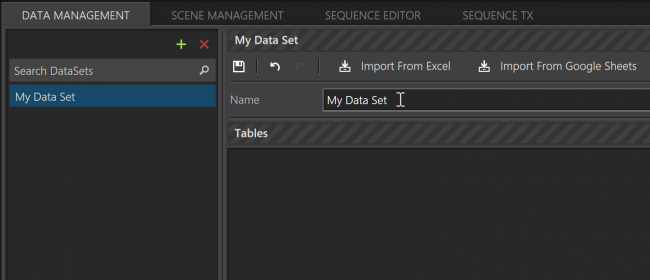
Note: Remember to click the white save icon to save any changes made to your Data Set.
Create From Excel
Click the ‘Create From Excel’ button
Select the excel file from the open file dialog
This will import a table for each sheet in the excel file. The name of the Table will be the name of the tab within the excel file
The Tables in the Data Set will match the most recently uploaded excel file – so if a Table exists in the Data Set that doesn’t have a corresponding tab in the excel file that is being uploaded, that Table will be deleted from the Data Set. If a Table does exist that matches a tab, that Table will be updated with the new data.
Create From Google Sheets
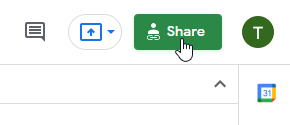
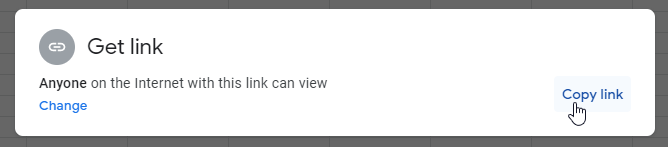
You'll need to create a Google Sheets spreadsheet, and generate a sharing link for it, by clicking 'Share', then 'Copy Link'
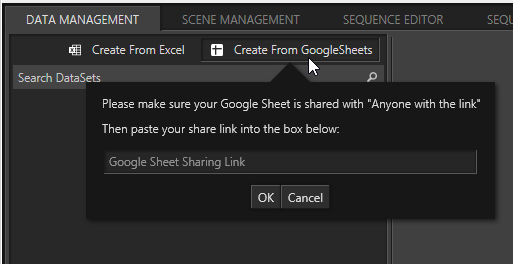
In Ignition, click the 'Create From GoogleSheets' button in the top-left, and paste in your sharing link
You'll see all the sheets that belong to your spreadsheet. For each one that you want to use, click 'Sync Now'
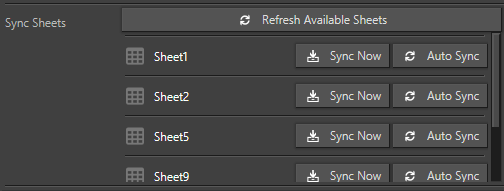
Note: if you create a new sheet within your spreadsheet, you can use the 'Refresh Available Sheets' button to update the list of sheets.
Use the 'Auto Sync' button to toggle automatic polling for updates for a particular sheet. This allows your charts to update in real time as data changes in your google sheet
Note: if there are errors syncing your sheet, for example if the schema doesn't match (see section below), this will be reported in the 'History' section to the right, with information about the problem
Data Schema
The cells in the spreadsheet are expected to conform to a schema so that the correct information can be extracted. Any sheet in the workbook that doesn’t conform to this schema will be ignored by the upload.
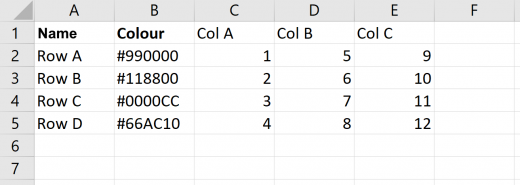
The first row must contain ‘Name’ then ‘Colour’ in the first two columns. There should then be at least one more column of data, but there can be as many more as you like. The text in the first row for these data columns should be as you would like it to appear on graphics.
Subsequent rows should contain the relevant information about that row. ‘Label’ should contain text for how that row should be labelled on graphics. ‘Colour’ can be left blank, but if it is filled in it should use hex colour notation as shown. Each other column should contain numerical data.
How this data is represented in different charts:
Column Chart
One particular column of data is chosen (from column C onwards, selected by it’s row 1 text). The Chart will then display one bar for each row of data (from row 2 onwards) for the chosen column, coloured up by the colour specified in that row.
Pie Chart
Similar to the Column Chart, one column of data is chosen. The Chart will then display a Pie with one slice for each row of data for that chosen column, coloured up by the colour specified in that row.
Line Chart
A Line will be drawn for every row of data (from row 2 onwards), coloured up by the colour specified in that row. Each column of data (from column C onwards) will correspond to a point along that line (the text in row 1, from column C onwards will appear along the horizontal axis).
Scene Management
Creating a Scene
(This is not about going off on a drunken rant at a dinner party)
Ignition Charting needs to know a little about how each Unreal scene is configured in order to talk to it correctly. Here’s what to do:
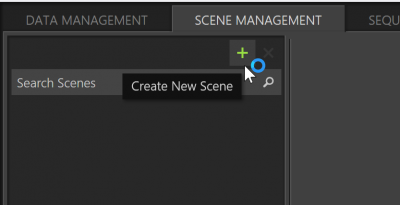
Create a new Scene in Ignition by clicking the green plus at the top of the left hand list of Scenes:
You can then give your scene a name from the main editor panel:
Note: Remember to click the white save icon to save any changes made to your scene.
Preview Cameras
The preview renderer needs to know about what preview camera positions have been set up in your Unreal project. These should be positioned to be able to see each instance of the Idonix Charting plugins that you are using in your project. These need to be named and assigned within the Main Controller plugin in your Unreal project (for more details on setting up your charting plugins and the Main Controller plugin see this article).
In Ignition, for each preview camera, use the camera ID assigned from your Main Controller, along with a friendly name that will appear on the preview camera control buttons in the Sequence Editor.
Add Graphics
You need to tell Ignition about the Idonix Charting plugins that exist in your Unreal project. Specifically we need to know what name they have been given within the Main Controller plugin (for more details on setting up your charting plugins and the Main Controller plugin, see this article).
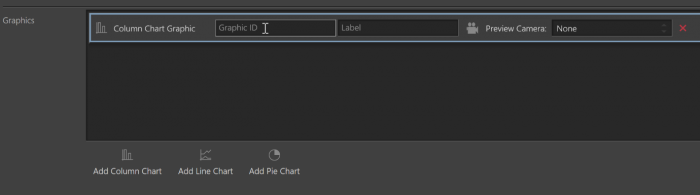
Use the Label property to define what will show up in Ignition when building sequences of graphics.
Set the preview camera for each graphic so the embedded preview knows which camera to switch to when you are editing that graphic.
The Sequence Editor
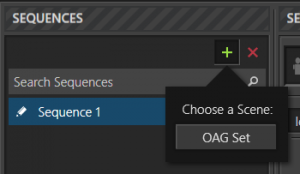
Create a new Sequence by clicking the green plus button at the top of the left hand list of Sequences. You’ll be asked to choose a Scene that this Sequence will be driving:
The Sequence Editor is comprised of the following sections:
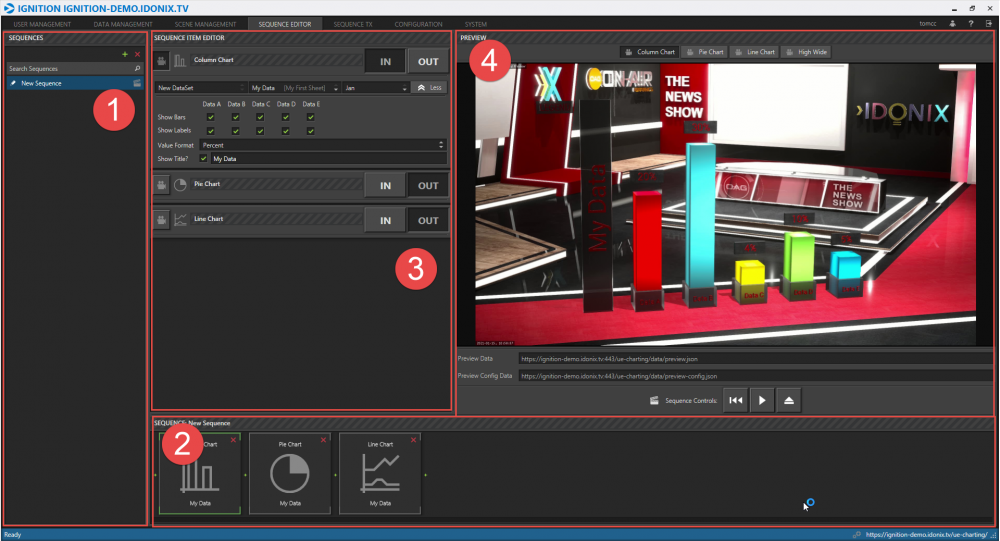
Sequences List – click the Sequence you want to edit.
Sequence Items – this is the timeline of Sequence points. Advancing the Sequence will move to the next Sequence Point. The Sequence point highlighted in green is the currently selected Sequence point that is being edited in the Sequence Item Editor. Use the green plus button between sequence points to add new sequence points.
The Sequence Item Editor. This lets you choose which graphics should be in at this point in time along the sequence. Each graphic you have defined in your Scene will be available to select in this editor. Bring in a graphic by clicking the IN button. You can then select the data you want to visualise on that graphic, along with more advanced options by clicking the ‘More’ button. Use the lightning bolt icon to toggle whether changes in data should automatically update when this graphic is in.
The Embedded Preview (if enabled). At the top of the preview you can manually choose what preview camera to switch to (the preview camera switches automatically when editing a particular graphic). Below the preview are playout buttons so you can animate through the sequence from start to finish, visualising the in and out and updating animations for each graphic.
Note: If not using an embedded preview, you can connect a local Unreal engine to be used as a preview engine. To do this, use the “Preview Data” and “Preview Config Data” urls located below the preview window, and copy/paste them into the relevant urls in the Main Controller plugin on that Unreal machine.
Note: When a sequence is active in the Sequence TX screen, you won’t be able to edit it.
Sequence Tx
The Windows Client
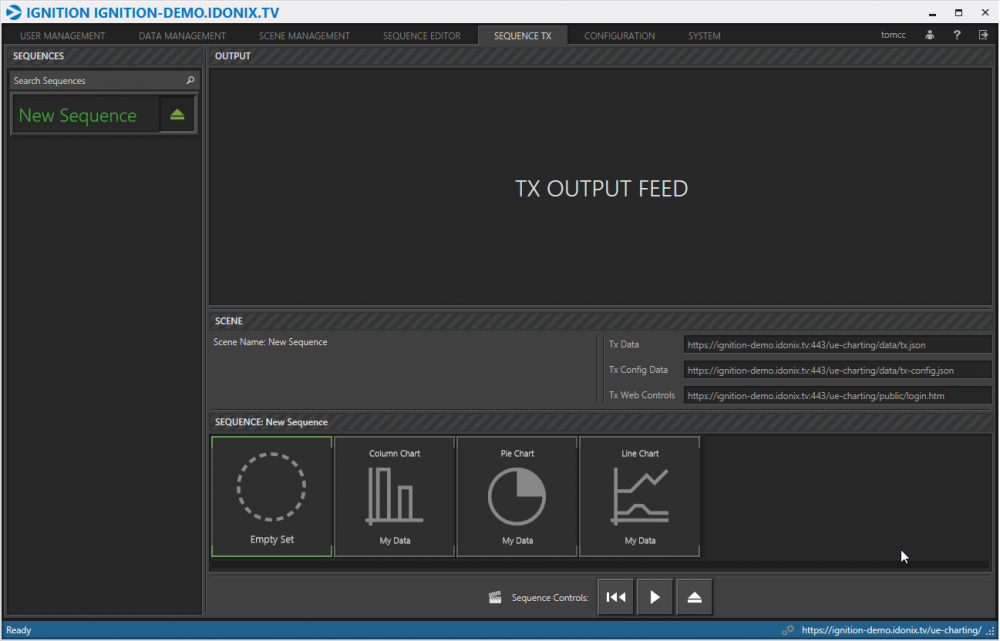
The Sequence TX screen lets you choose a Sequence from the left hand list and play it out to your tx instance(s). Use the play button next to a Sequence to activate it on the TX screen (this will make that Sequence read-only in the Sequence Editor, so it can’t be changed whilst being played out.
The Horizontal Sequence view shows you all the graphics that are in this Sequence, and which one is currently active.
Note: To connect your live Unreal engine(s) to Ignition, use the “Tx Data” and “Tx Config Data” urls located above the horizontal Sequence, and copy/paste these into the relevant urls on the Main Controller plugin within your Unreal project (for more information on setting up the Main Controller plugin, see this article).
Web Client
A web-based version of the Sequence TX view is available for embedding into other applications, the url for which can be found under “Tx Web Controls” in the Sequence Tx screen.