Caveat: You need to have Template Editor permissions. It may be sensible when naming new hooks, new templates or new template sets to add "TRAINING" as part of the name, to differentiate your work from 'live' production work. Do consider any 'Delete' actions carefully - is it your work you are deleting?
Adding a Scene
Using Ignition Post Win Client as a Template Editor.
Select the main tab DATA
Select the sub-tab SCHEMAS & HOOKS
Below SCHEMAS:
Data Provider: XMLTeam
Target: Production
Schema: soccer event-report
Sample Data: Southampton v Leicester City
Select the main tab TEMPLATES
Ensure the template set 'TRAINING Match' is selected (above 'Search Templates')
Select your 'Scorelines' template
From the 'TEMPLATE' pane, click the 'Select' button adjacent to 'Scene'
There may already have been a sub-pane to the right-hand side, but now there certainly will be:
BROWSE SCENES
With:
Renderer Domain
Graphics Hub
And a list of your available scenes below 'Search'
Ensure 'Renderer Domain' = Viz
Ensure 'Graphics Hub' = Post --- (Or the name of what is pointing at your available Viz Scenes)
Type the following into the 'Search' bar:
GEN_P_S_L3_MS
You may get more than one option of where a scene is available, select and expand:
BBC-SPORT/SCENE/FOOTBALL/MOTD/IDONIX/2017
Identify the 'GEN_P_S_L3_MS' scene
Click 'Refresh Thumbnail and Scene Controls'
Click 'Click button to make this the current main scene'
Select the sub-tab CONTROLS, ensure it has the Schema: 'soccer event-report'
Now add a 'Data Item' control
Choose the 'Schedule Condition Hooks.Event Name Abbr' hook
Click the greyed out 'title' on the control -- it turns 'green'
This sets the Title of the Graphic to the data returned from the control.
Add a 'Data Item Selector' control
Set the 'List Hook' as: 'Scorelines'
Change 'Id (Value)' to: 'Index'
Change 'Display' to: 'Selector'
Change Label to: 'Scorelines Selector'
Click the greyed out 'title' on the control -- it turns 'green'
You should have an image set with the logo for each premier league football team. For the remainder of the tutorial, this will be referred to as the image set - 'Scorelines'.
Add six 'Data Item' controls and bind as follows:
UPPER TAB_1
HOME_TEAM
HOME_FLAG
AWAY_TEAM
AWAY_FLAG
SCORE_Vs
To each of the above template controls add a hook as indicated and a filter as indicated:
UPPER TAB_1
Change the 'Data Selector' from 'Match' to: 'Scorelines Selector'
Hook = 'Scorelines.S L Tab'
HOME_TEAM
Hook = 'All Teams.Full Team'
Add a Filter: alignment (=), Constant, "home"
HOME_FLAG
Hook = 'All Teams.Team Key'
Add a Filter: alignment (=), Constant, "home"
Image Set = 'Scorelines'
AWAY_TEAM
Hook = 'All Teams.Full Team'
Add a Filter: alignment (=), Constant, "away"
AWAY_FLAG
Hook = 'All Teams.Team Key'
Add a Filter: alignment (=), Constant, "away"
Image Set = 'Scorelines'
SCORE_Vs
Change the 'Data Selector' from 'Match' to: 'Scorelines Selector'
Hook = 'Scorelines.Score'
Selecting Scoreline data based on the User's Scoreline Selection
You are now ready to start on the Template's data. You will now be adding a number of DataList controls. These will have the scoreline data list hook as their source hook. Each will be bound to a list of Viz Controls in the usual way.
If this is all you did, then the graphic would always show all the goals up to the end of the match. However, you can filter these lists down using the 'Add Filter(s)' magic wand.
Filters are based on existing constraints in the control's source list hook - that is why you created them earlier. By creating filters here you can effectively override the value the Constraint is using, but just for this particular Control. So you can use the same list in multiple controls, but producing different sets of data. You can specify either a constant text value for this override (e.g. 'home' or 'away' for alignment), or you can specify the value of another hook. This is where the magic comes in because you set your filters to the value of hooks in your Scoreline Selector hook and control.
N.B. When you bind a Viz Control to a template control the template control will automatically be renamed to the Viz Control - but it's always good practice to give it a more meaningful name.
In 'TEMPLATES' and the 'CONTROLS' Tab, with the 'Scorelines' template highlighted:
Using the 'Data List' button create x4 new controls
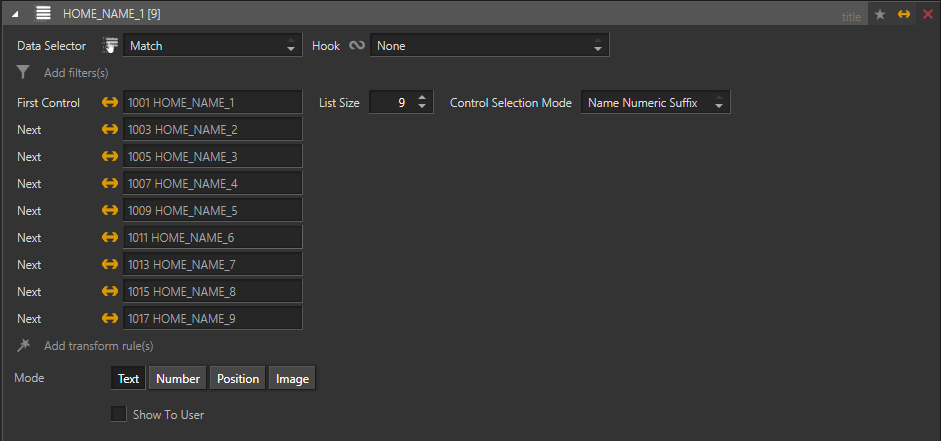
Change the 'List Size' = 9
Taking each of the four new template controls, in turn, bind a Viz Control as follows:
richtext 1001 HOME_NAME_1
richtext 1002 HOME_TIME_1
richtext 2001 AWAY_NAME_1
richtext 2002 AWAY_TIME_1
You will note the x8 similar Viz Controls were automatically allocated within the template control and the four controls took on the name of the Viz Control.
Here is the 'HOME_NAME_1' example:
You now need to give each of the four template controls a hook and add x3 filters.
HOME_NAME_1
Change Hook to: GoalsByPlayer.Scorer.Player Idref.Last
Add filters: period-value (<=)
Change to: 'Hook' (I.E. Click the depressed button labeled 'Constant' with a Pin Icon, then select 'Hook')
Change to: 'Scorelines Selector' (I.E. Click the depressed button 'None', then select 'Scorelines Selector')
Select: 'Scorelines.Period Value' (I.E. Click 'None', select 'Scorelines.Period Value')
Add filters: minutes-elapsed (<=)
Change to: 'Hook' - Change to: 'Scorelines Selector' - Select: 'Scorelines.Minutes Elapsed'
Add filters: team-idref (=)
Change to: 'Hook' - Change to: 'Match' - Select: 'Home Team.Id'
HOME_TIME_1
Change Hook to: GoalsByPlayer.mepvsat
Add filters: period-value (<=)
Change to: 'Hook' - Change to: 'Scorelines Selector' - Select: 'Scorelines.Period Value'
Add filters: minutes-elapsed (<=)
Change to: 'Hook' - Change to: 'Scorelines Selector' - Select: 'Scorelines.Minutes Elapsed'
Add filters: team-idref (=)
Change to: 'Hook' - Change to: 'Match' - Select: 'Home Team.Id'
AWAY_NAME_1
Change Hook to: GoalsByPlayer.Scorer.Player Idref.Last
Add filters: period-value (<=)
Change to: 'Hook' - Change to: 'Scorelines Selector' - Select: 'Scorelines.Period Value'
Add filters: minutes-elapsed (<=)
Change to: 'Hook' - Change to: 'Scorelines Selector' - Select: 'Scorelines.Minutes Elapsed'
Add filters: team-idref (=)
Change to: 'Hook' - Change to: 'Match' - Select: 'Away Team.Id'
AWAY_TIME_1
Change Hook to: GoalsByPlayer.mepvsat
Add filters: period-value (<=)
Change to: 'Hook' - Change to: 'Scorelines Selector' - Select: 'Scorelines.Period Value'
Add filters: minutes-elapsed (<=)
Change to: 'Hook' - Change to: 'Scorelines Selector' - Select: 'Scorelines.Minutes Elapsed'
Add filters: team-idref (=)
Change to: 'Hook' - Change to: 'Match' - Select: 'Away Team.Id'
There are two viz control objects still available, both allowing the user to either have logos or not.
Add a 'User Option' control
Bind to:
Integer 9001 LOGOS
The control is automatically set a default (i.e. the first/top item) and automatically populates the following:
A Viz Scene can be designed to have the ability to switch items off and on. The ability can be assigned to various triggers, in this instance '1' is to show the logo.
Change the 'Value' items around, so:
Description: Yes - Value: 1
Description: No - Value: 0 DEFAULT
Add a 'User Option' control
Bind to:
Image 9002 OTHER_LOGO
Change the two 'Value' items around, so:
Description: Yes - Value: 1
Description: No - Value: 0 DEFAULT
Your graphic is now ready to be used.
Using the Web Client to view your new template. Remember to Login as a Template Editor, as the template is not yet published.
There will be three panes:
From the 'Templates' pane, first, you have to choose the template from which you want to make a graphic.
Select the 'TRAINING Match' template set
Set the sample data to: Watford v Tottenham Hotspur
Highlight the 'Scorelines' template
Click 'Click to create and edit a video graphic from this template'
NOTE - The 'Edit' pane will now populate with your template, the 'Match' field has been populated with the data you selected - in this instance, it is only 'Sample Data', rather than data being provided by your 'Data Provider'. Within the 'Edit' pane, the 'Scorelines Selector' field is populated with the first instance from your sub-hook 'Selector', which has fixed rows and is ordered.
Click within the 'Scorelines Selector' field. (A dropdown will appear with all the available scores and important points during the match; i.e Pre-Match, Start, Half-Time & Full-Time.
From the dropdown select the option for Full-Time
Within the 'Templates' pane:
Set the sample data to: Burnley v Manchester United
Highlight the 'Scorelines' template
Click 'Click to create and edit a video graphic from this template'
Within the 'Edit' pane, click within the 'Scorelines Selector' field
From the dropdown select the option for Full-Time
Within the 'Templates' pane:
Set the sample data to: Southampton v Leicester City
Highlight the 'Scorelines' template
Click 'Click to create and edit a video graphic from this template'
Within the 'Edit' pane, click within the 'Scorelines Selector' field
From the dropdown select the option for Full-Time
Within the 'Templates' pane:
Set the sample data to: Cardiff City v Arsenal
Highlight the 'Scorelines' template
Click 'Click to create and edit a video graphic from this template'
Note the 'Preview' sub-pane (at the bottom of the 'Edit' pane) is providing a default representation of what your graphic would like, i.e. Cardiff City v Arsenal
Now to show you the power of your graphic, with nine different occurrences (for the Cardiff City v Arsenal match anyway).
Within the 'Edit' pane, click within the 'Scorelines Selector' field
From the dropdown select the option for each occurrence in turn, first:
Pre-Match [ v ]
Within the 'Edit' pane, click within the 'Scorelines Selector' field
From the dropdown select the option for each occurrence in turn:
Start [0-0]
Within the 'Edit' pane, click within the 'Scorelines Selector' field
From the dropdown select the option for each occurrence in turn:
ARS Mustafi 11' [0-1]
Within the 'Edit' pane, click within the 'Scorelines Selector' field
From the dropdown select the option for each occurrence in turn:
CAR Camarasa 45'+2' [1-1]
Within the 'Edit' pane, click within the 'Scorelines Selector' field
From the dropdown select the option for each occurrence in turn:
HALF-TIME [1-1]
Within the 'Edit' pane, click within the 'Scorelines Selector' field
From the dropdown select the option for each occurrence in turn:
ARS Aubameyang 62' [1-2]
Within the 'Edit' pane, click within the 'Scorelines Selector' field
From the dropdown select the option for each occurrence in turn:
CAR Ward 70' [2-2]
Within the 'Edit' pane, click within the 'Scorelines Selector' field
From the dropdown select the option for each occurrence in turn:
ARS Lacazette 81' [2-3]
Within the 'Edit' pane, click within the 'Scorelines Selector' field
From the dropdown select the option for each occurrence in turn and finally:
FULL-TIME [2-3]
You could now try the tutorial to produce a Formation graphic, available at the link below:
Formation graphic for Football
Or the tutorial to produce a Single Substitution graphic, available at the link below:
Single Substitution graphic
Or the tutorial to produce a Yellow Red Card graphic, available at the link below:
Yellow and Red Card graphics