Goal
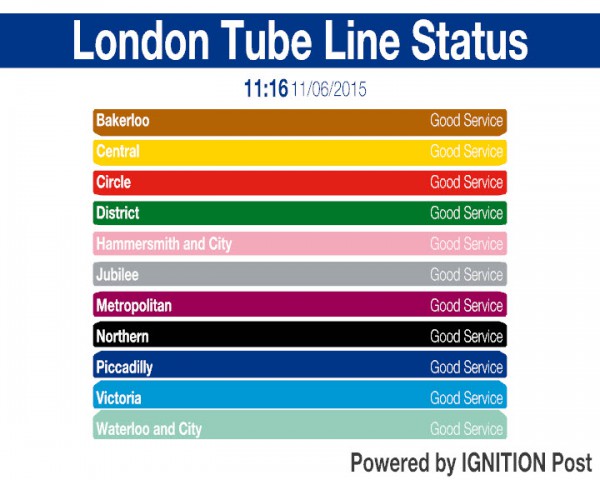
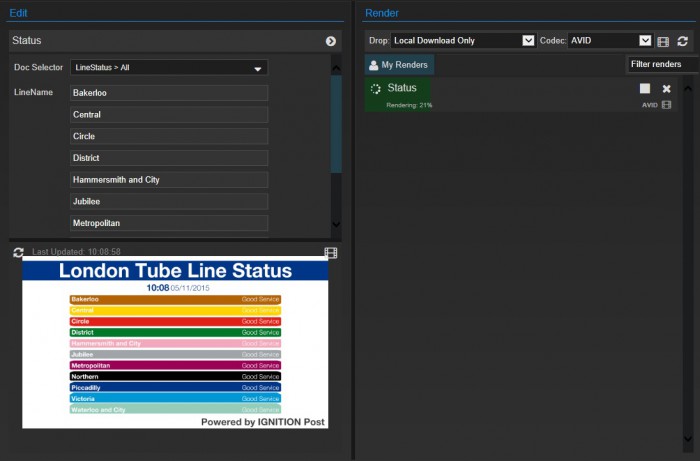
You will make a simple graphic driven by live data. The live data you have chosen for this graphic is the status of the tube lines on the London Underground. The finished product will look something like this:
A tutorial for creating a graphic depicting information on the current status of the London Underground
You will make a simple graphic driven by live data. The live data you have chosen for this graphic is the status of the tube lines on the London Underground. The finished product will look something like this:
First things first, you need some data to drive this graphic. As delivered by the Transport For London API in its raw form this data is given to you as XML, a small section of which is shown below:
<ArrayOfLineStatus xmlns:xsi="http://www.w3.org/2001/XMLSchema-instance>
<LineStatus ID="0" StatusDetails="">
<BranchDisruptions/>
<LineID="1" Name="Bakerloo"/>
<StatusID="GS" CssClass="GoodService" Description="Good Service" IsActive="true">
<StatusType ID="1" Description="Line"/>
</Status>
</LineStatus>
<LineStatus ID="1" StatusDetails="">
<BranchDisruptions/>
<LineID="2" Name="Central"/>
<StatusID="GS" CssClass="GoodService" Description="Good Service" IsActive="true">
<StatusType ID="1" Description="Line"/>
</Status>
</LineStatus>
This is pretty verbose and hard to read - fortunately, you have got a Data Provider that nicely encapsulates this XML structure for us. You will find 'TFLProvider' in the data providers dropdown. The Schema is 'LineStatus'. Go ahead and download this schema if it has not been already and look at the schema structure, using the 'LineStatus > All' sample data:
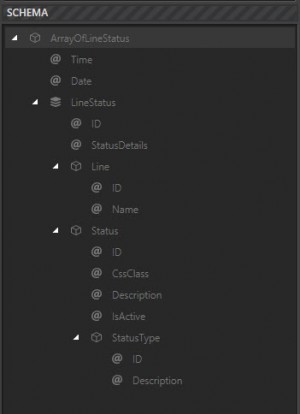
You will notice the names of the nodes in this schema tree correspond to the names of certain bits of the XML above - namely the elements and attributes - but this does not matter; the point is you can now see how your data will be represented and what data you are able to hook into.
You will also then be able to use the Peek button on the schema tree to see what data will be output for a particular node in the tree.
Now you have got a schema representation of your data, you can create some hooks into it. The first thing you want to do is hook into the top level 'Time' and 'Date' nodes - these hooks will be used to drive the Time and Date section at the top of your graphic.
Once hooked up, you can click the 'Evaluate all' button on the right to check the output of all of the hooks created so far. At this point, you should see today's date and the current time!
The next hook you want is a list hook; this is a hook which returns multiple values - one for each item in the list it is hooked on to. Create a hook on the 'LineStatus' node of the schema. Rename this hook to 'Lines' as this is more descriptive of what the hook returns.
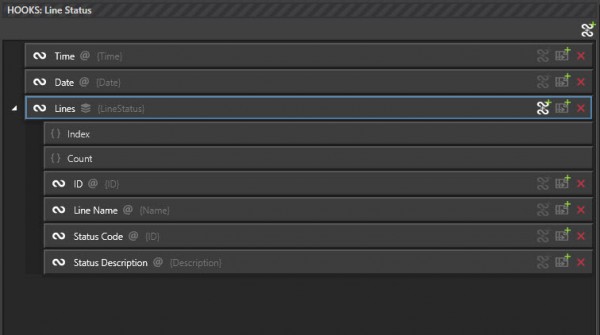
With the 'Lines' Hook selected, go ahead and create sub hooks for the following nodes:
Line > ID
Line > Name (rename this Line Name for clarity)
Status > ID (rename this Status Code for clarity)
Status > Description (rename this Status Description for clarity)
When you are done you should end up with something looking like this:
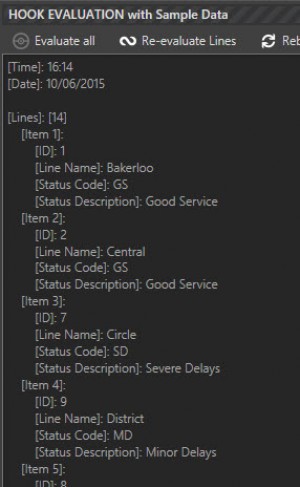
Clicking 'Evaluate all' will produce data similar to this:
You are going to be driving a graphic that also needs to be sent two-letter codes corresponding to each tube line, used to select the correct colour for each bar in the graphic. These two-letter codes are not provided in your data - why should they be? They are graphic specific - so you will need to use a Lookup to find the correct code.
This link has the lookup (CSV File): TFL Line Codes
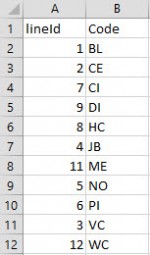
Upload this as a Lookup from the 'LOOKUPS' tab - name it 'TFL Line Codes'.
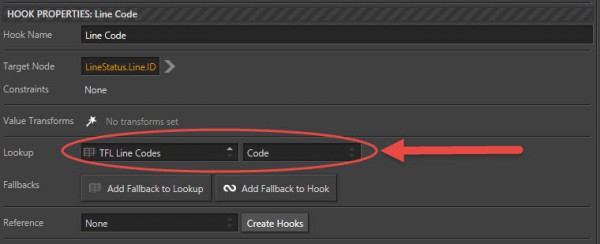
Now you can use this lookup in your hook setup. Create another Hook targeting 'Line > ID' as a sub-hook of your 'Lines' list hook. Rename this 'Line Code'. Select your Lookup from the drop-down list in the hook editor panel, then select 'Code' as the lookup target:
Evaluating this lookup will now yield the following output:
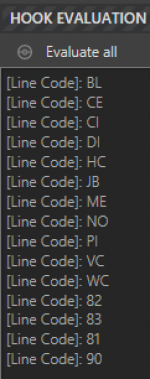
You will notice the four line codes at the end did not have a lookup associated with them. This is because they are not London Underground lines and you are not interested in them for this graphic (81=DLR, 82=Overland, 83=TfL Rail & 90=Trams). You can filter out these unwanted lines by adding a constraint to your 'Lines' list hook. There are a number of ways you can exclude these lines - you will constrain the list (i.e. select 'Lines') by only selecting items where Line ID < 80, like below (NOTE - 'Number' is selected rather than 'Text'):
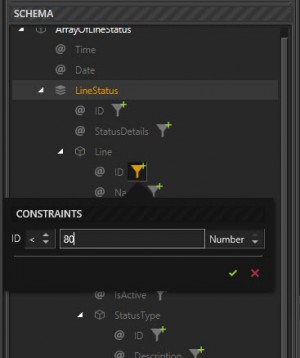
After doing this, you will see your 'Lines' list now only returns 11 items, which is handy considering there are only 11 available bars on your graphic!
The next thing you want to do is order your list of 11 lines so the most severe delays are at the top. To do this you will need another lookup - this time to convert your status codes (GS = Good Service, MD = Minor Delays etc.) and turn them into numerical values that you can sort by.
This link has the lookup (CSV File): TFL Status Order
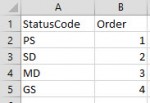
Create a new hook targeting 'Status > ID' as a sub-hook of your 'Lines' list hook. Use the newly created lookup to convert this into your orderable number and rename this hook 'Status Order'.
Next, you can add a list transform to your 'Lines' list hook to make it order by your newly created 'Status Order' sub-hook:
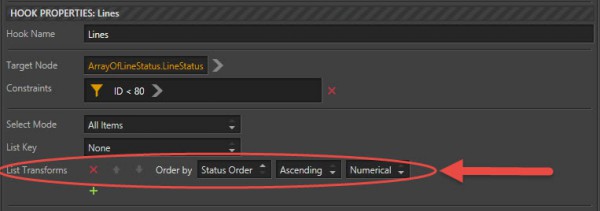
Now all the delayed lines will float to the top of your list, in order of severity. And with that, you are ready to create a Template for your graphic!
First of all, you need to create a template for your graphic - call it 'TFL Tube Line Status'.
You can create a new template set for this template if you like. You have put yours in the 'TFL' template set.
Next, you want to link your template to a Viz scene. The scene you want can be found under 'Idonix/TFL/TFL_LineStatus'.
The scene can be downloaded via the link below:
NEEDS WORK HERE - the .via currently has Helvetica font (the user may not have this) and the .via is using other resources that are in a file tree including 'Elections' items etc.
THE VIA FILE NEEDS TO BE SAVED INTO THE /downloads/assets/knowledge-base/ignition-post/via/ FOLDER AS tfl-line-status.via IF THE LINK IS TO WORK - BUT THE SCENE NEEDS TO WORK IN VIZ AND FOLLOW A NAMING CONVENTION - SO SOME THOUGHT MAY BE NEEDED HERE ALSO!!
Do not forget to click 'Get Defaults' after choosing the Viz scene. Amongst other things, this will give you the correct preview frame so you can see what your rendered output will look like.
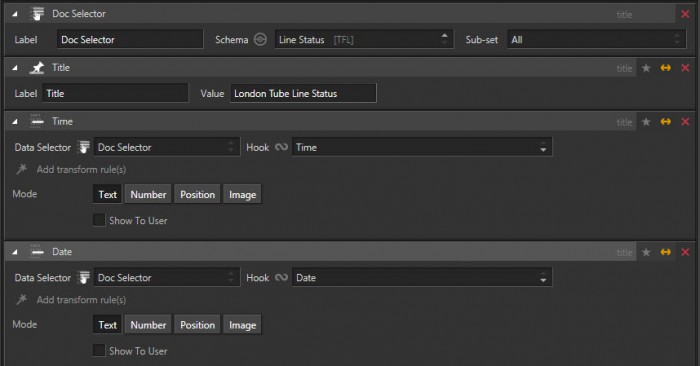
Set up your controls - first of all, you want a Document Selector:

Choose your LineStatus Schema from the dropdown menu. This will allow you to bind other controls to the hooks you have previously built on this schema.
Now you want to bind some data to the Viz Control Objects of this Viz Scene. By looking at the control objects on the right-hand panel, you can notice a few things:
There are 11 'LineName' objects with Ids 1001 - 1011 (one for each row in the graphic)
There are 11 'LineStatus' objects with Ids 2001 - 2011 (one for each row in the graphic)
There are 11 'Image' objects with Ids 3001 - 3011 (one for each row in the graphic)
There are objects for 'Time', 'Date' and 'Title' also
First, deal with the Title. You do not need a hook to get this data, you just want to use a fixed value. Drag in a 'Fixed Value' control, bind it to the 'Title' viz control object and enter 'London Tube Line Status' as the fixed value.
Next, add your first two binding to data - for the 'Time' and 'Date' control objects. Drag in two 'Data Item' controls, choose the Document Selector you have previously added as the 'Data Selector' property, choose the 'Time' and 'Date' Hooks respectively from the Hook menus on each control, then bind them to the 'Time' and 'Date' viz control objects.
Your current Control setup should look something like this:
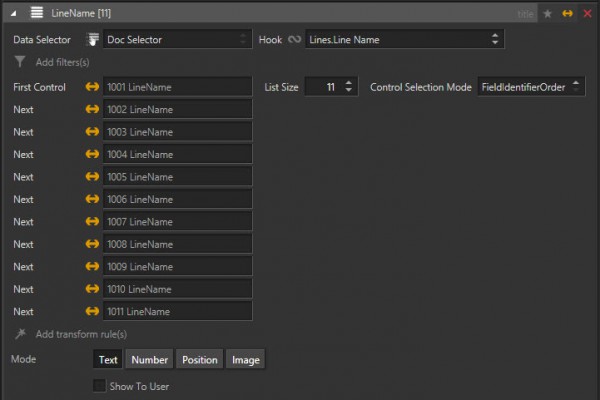
Now add some lists: Drag in a 'Data List' control, select your Document selector, then select the 'Line.Line Name' hook. You will notice the hooks available to be chosen by this control are only sub-hooks of a list; they are hooks that will yield multiple data outputs; one for each item in their parent list.
To bind this control to multiple viz control objects, you need to bind the control to the _first_ viz control object, then set some parameters to automatically find subsequent objects. You want to bind to the 11 'LineName' viz control objects, so bind this control to the first one (id 1001). Because all of the viz control objects you want to bind to are named the same, you cannot use the 'NameNumericSuffix', nor the 'NameAlphabetically' control selection modes - but you can use the 'FieldIdentifierOrder' option. If you choose this option, then set the list size to 11, you will notice items 1001 - 1011 light up yellow in your viz control objects list and your control will show them like so:
This will give you a list of the line names. You need the all-important Status, so add a new Data List control, choose the 'Status Description' hook and bind it to the 'LineStatus' Viz control objects, following the same procedure as the LineName above.
Now you need to colour the straps correctly- so another Data List control, this time binding to the 'Line Code' hook and the Viz 'Image' control object. When a viz control is an image the default for the template control is image, for this scene to function it requires a text string. Change the 'Mode' from 'Image' to 'Text'.
You can now switch to the Web Client and have a look at your graphic.
Looks like there is a good service on all lines at the moment. Remember to publish the template to make it available to your operators!