Ignition: The Data Powerhouse Behind the BBC's US Election Coverage
Election feeds from Reuters, graphics in three languages, enquiry tools for journalists, and the data powerhouse behind the BBC Online coverage
Think we could be a good fit for your next project? Get in touch

Elections in the US are full of data. Over 3,000 counties reporting from among 50 states (51 units if you count DC), constantly updating their vote counts as more data comes in – from not only the Presidential race, but House, Senate and Gubernatorial races too.
But with such a vast quantity of information, how do you turn that complex data into an engaging story? Read on to find out how Idonix’s Ignition software helped the BBC deliver top quality content both on-screen, online and behind the scenes.
Overnight viewers
Language services
Ignition In The Cloud
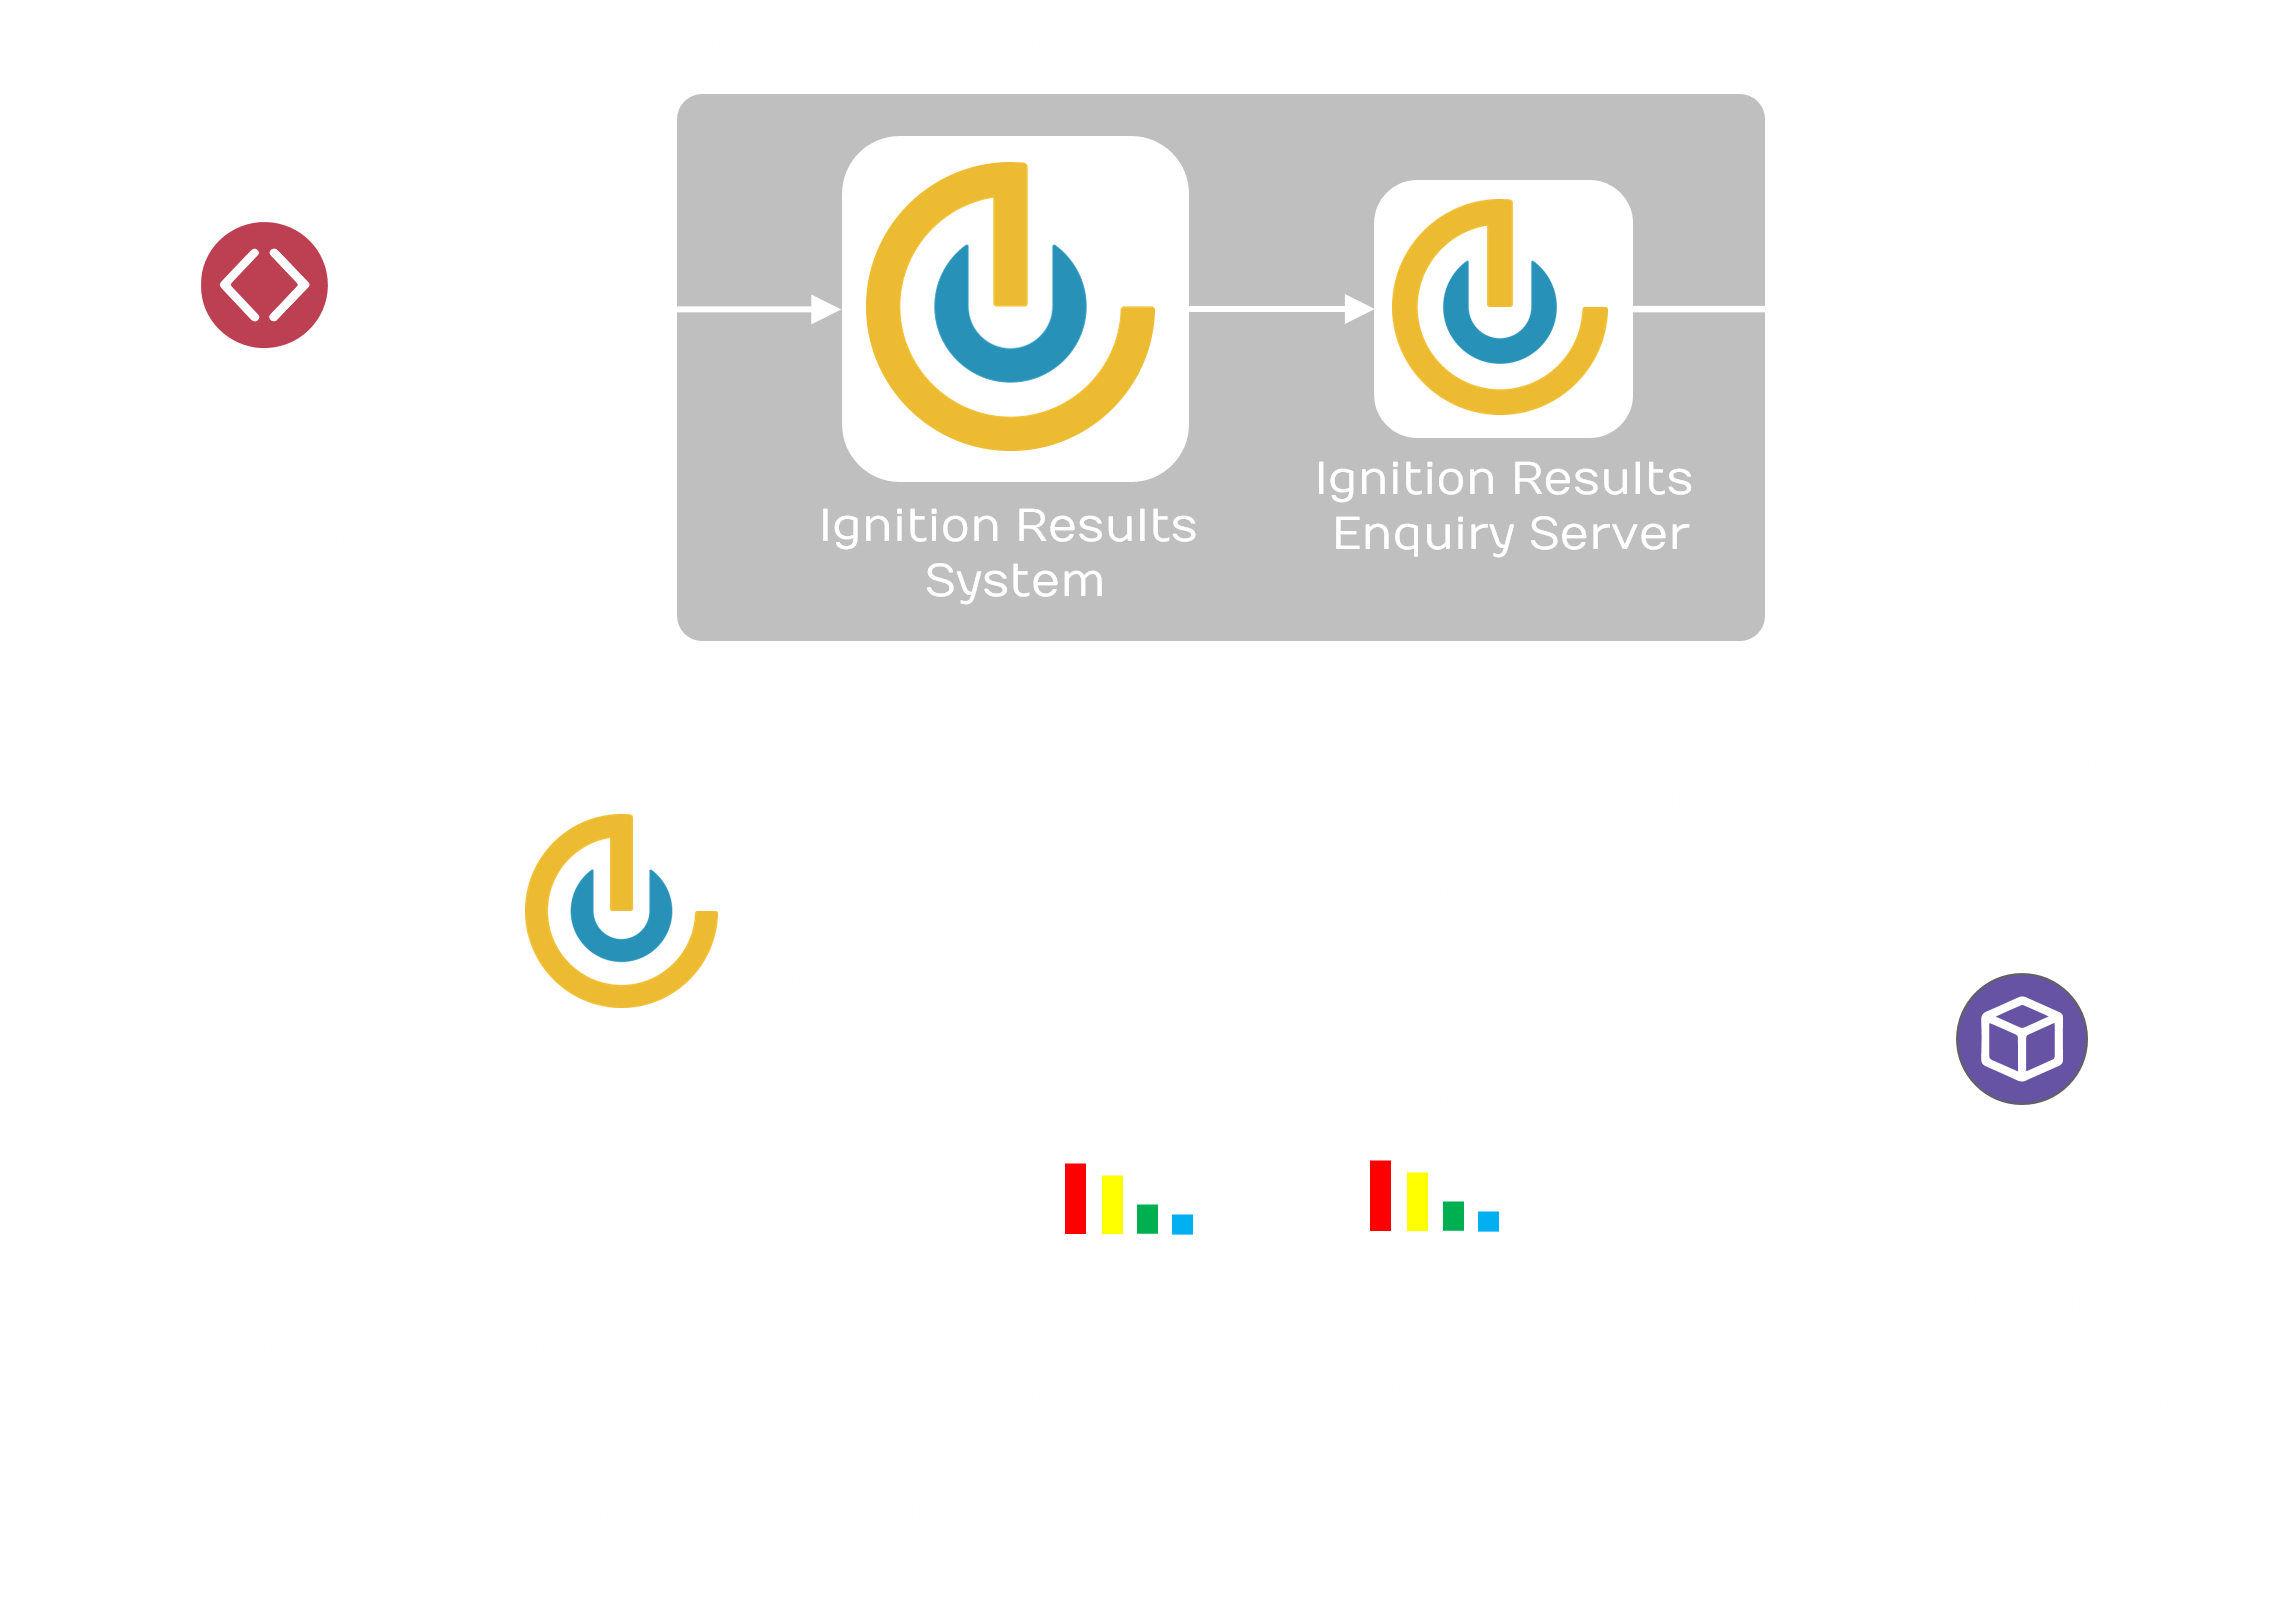
With such vast quantities of data needing to be ingested, parsed, stored then delivered to so many platforms in so many locations, we decided to host our main Ignition results server in the cloud with Microsoft Azure. This meant that we could easily scale the hardware we were using to meet the heavy data processing demands of this election. It also meant that this system could be maintained and supported remotely, meaning we could keep a minimum support effort deployed inside the BBC to help with their strict social distancing restrictions at the time.
Ingesting Reuters Data
This was a new one for us this year. It was the first time we’d taken election data from Reuters, so we had to build a bespoke data ingest system to fit the requirements. Polling at regular intervals and keeping track of sequence numbers to make sure we take only the most up-to-date information, with incremental back-off when the service is temporarily unavailable when scaling to meet demand.
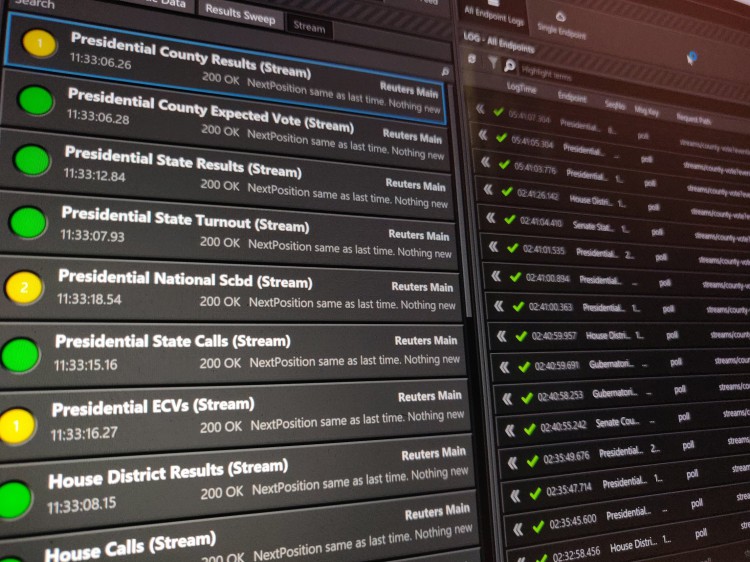
Over the course of the election night and day two broadcast, we clocked up over 35,000 unique data updates from Reuters endpoints, most of which would have contained multiple documents. each pertaining to a single reporting unit.
Unique data updates from Reuters endpoints
Driving Graphics
With Ignition, we pride ourselves on creating simple, pick-up-and-use graphics driving software. This became increasingly important this time around when the graphics operators were situated in a separate room, on a separate floor of New Broadcasting House in order to comply with social distancing guidelines.
Some of these operators had never used our software before, and yet were able to turn up after a brief video-call training session and jump straight in to TXing graphics like a pro.
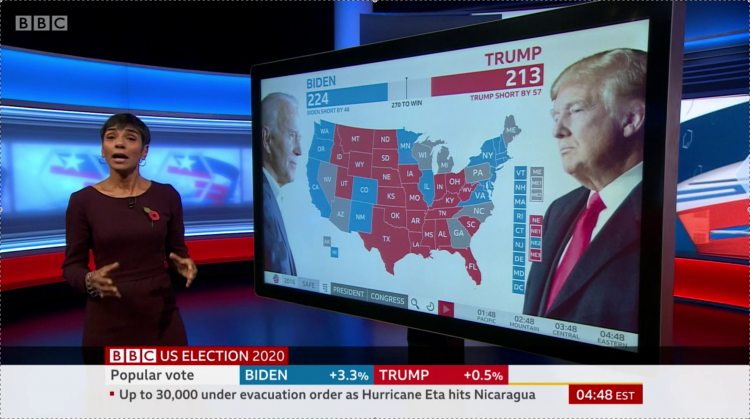
Lower Thirds and Full Forms
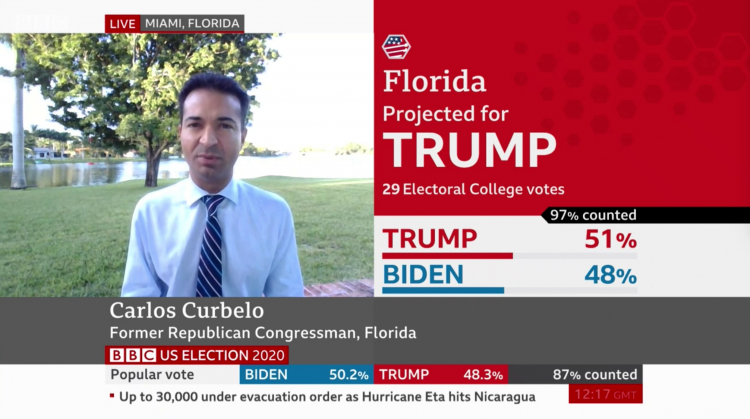
The bread and butter of any election special – these graphics tell the ongoing story in a simple to understand yet elegant way. Some graphics automatically rotate through different data-driven options, like the lower-third tally, others rotate through sets of manually typed information, such as the news ticker/flipper. We also provided TX stacks to be able to pre-build set-pieces of full-form graphics such as top-of-the-hour updates, with all states where polls close on that hour.
Three Languages
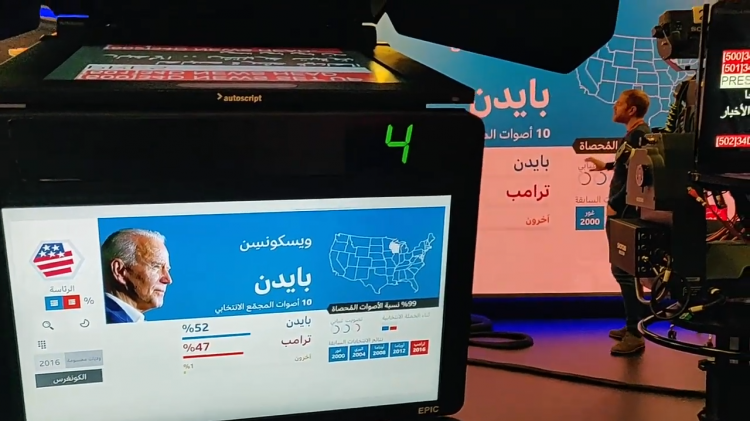
Another first for Idonix: automation of full form and touch screen graphics for the BBC’s Arabic and Persian services. We made good use of Ignition’s extensive localisation features here, with translations for standard “model” elements such as state and candidate names, and of course for more “constant” elements within the graphics such as headings and titles. Our GUI offers full support for right-to-left text, and for alternate numbering systems such as that used by the Farsi language.
Augmented Reality API
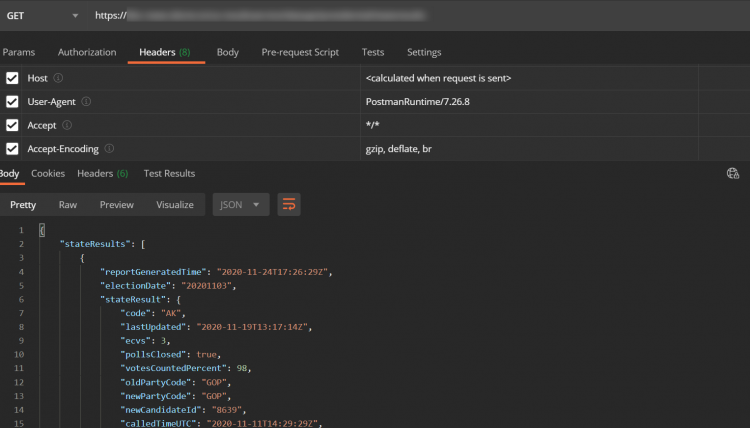
This was a relatively late-breaking requirement from the BBC, who had contracted the Israeli graphics vendor ARTI to generate cloud rendered AR graphics on their UE4 platform. It was straightforward for us to add a GET API to our Azure results platform, with results data formatted using the exact same rule base as that used in the Vizrt graphics.
HTML Graphics
An even later requirement! The BBC needed a data feed to drive a full form scoreboard graphic (part of a trial of HTML graphics rendered in the Chromium engine). It was an easy configuration change for us to expose the same GET API used by the cloud AR graphics to renderers within the internal BBC network.
Touchscreen
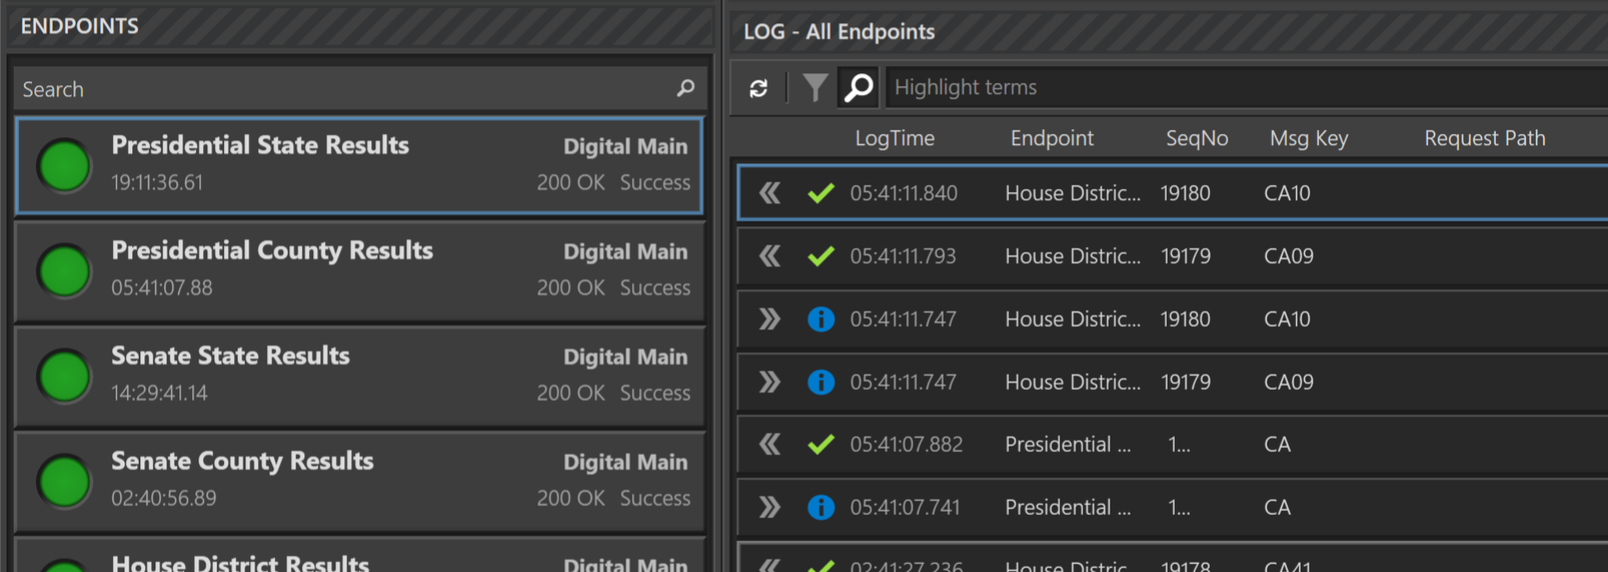
Our team worked closely with the BBC Viz developers, working to a clearly defined and fully documented API between Ignition and Viz – allowing for a clear separation of concerns. Ignition’s fully featured monitoring and logging system aiding the testing and troubleshooting process.
The touch screen’s core feature of an interactive “what-if, 270-to-win” map was easily covered by Ignition’s touch screen API, with a GUI extension offering an intuitive “story of the night” scenario builder that allowed the producer show how the election was won.
It was also gratifying that at least 75% of the touch screen functionality was covered by our core touchscreen libraries, proving the productivity gains of the Ignition platform.
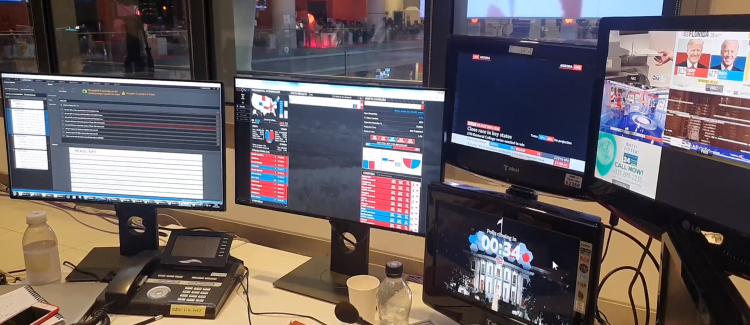
Results Enquiry Client
As well as automatically populating graphics, the data we receive and store from Reuters is also used to build our own internal model of the election. This model is then also displayed on a web-based ‘results enquiry’ system, with a wealth of customisation and filtering options to let users see the data how best it suits them – from sorting the results by how close the count is to completion, to grouping all the states where the polls are about to close – even allowing users to drill right down to individual county-level data if they wanted to pick through the minutiae to find interesting patterns or trends.
Users were given access using our standard user management workflow, and we even integrated with the BBC’s internal Single Sign-On system, allowing multi-factor authentication to be in place for added security and peace of mind.
This web client was used by over 300 members of BBC staff: from the editorial team, to researchers, visual journalists and even presenters. The screens were positioned in galleries, within desk monitoring, and even on tablets that reporters and presenters had to hand whilst on air.
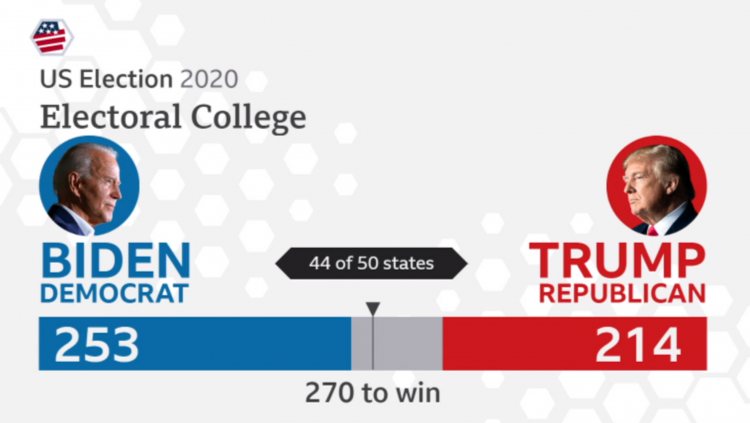
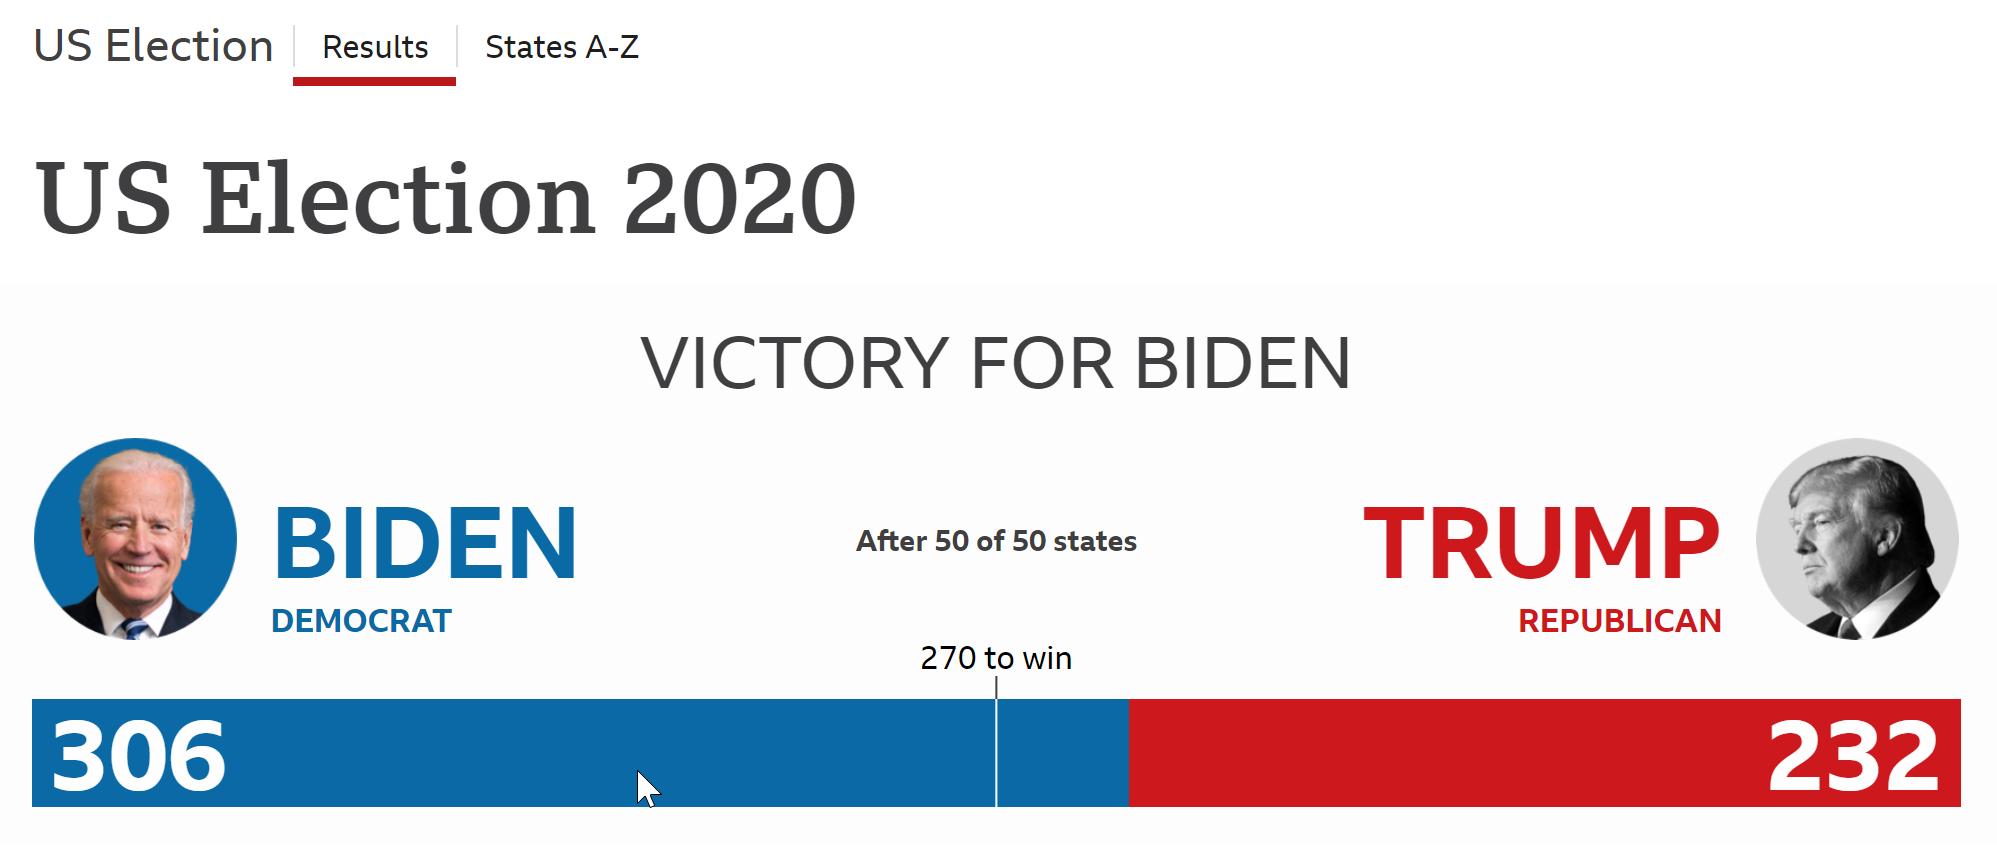
Driving Online Content
Ignition also posted data updates to the BBC’s Digital department using Amazon’s Simple Notification Service (SNS). This was another new one for us, but was simple to add using our extensible feeds pattern: Whenever a particular reporting unit was updated, there were some checks to see if anything important had changed, and if so a notification was generated and sent to a specific SNS topic.
This data feed allowed BBC Digital to capture the data that was important to them and store it in their own database in order to drive online content for the BBC website, as well as allow the Visual Journalism team to build their own graphical content and analysis.
Discrete updates posted to BBC Online's SNS queues
Day 2, 3, 4 and Beyond?
Usually with elections, the biggest and busiest time is overnight on election night, with a few dribs and drabs coming in on day 2. This one was a little different – with everything still in the balance way into day 2, and some states still counting in days 3 and 4 (and more…?), it was imperative that our systems were kept in place to keep telling the story as it unfolded.
This was easy for us – our cloud based results system could be left running in Azure for as long as we needed, and we were able to provide a POST API that injected updates to the election tally into the BBC’s standard ‘Business As Usual’ lower thirds system, giving the BBC News Channel’s rolling coverage constant access to the most up to date data as the last crucial states were still coming in.