ESports AR Maps
We’ve been working with election graphics for over 20 years so when we were approached about an eSports project, it made sense as the similarities are there to be seen - lots of data, the need for fast analysis and great looking graphics to engage and tell a rapidly changing story
Think we could be a good fit for your next project? Get in touch
Lots of eSports Data, One Map and Two Renderers
How we built PUBG’s AR analysis map graphic
With interest in eSports continuing to grow we thought we’d take a deep dive into one of our projects and look at how we built an AR map to work on two different graphics renderers with the same control interface.
Ignition
We used our Ignition software to handle the data integration and operator GUI
Remote

The system was built and supported remotely by us in UK with the client in the USA
Fanview
It was great working with Fanview Media, our partner on this project
This was only our second project using Ross Video's XPression
We've been working with Viz Engine since 2010
We’ll cover some key takeaways at the end but first let’s look at the video game itself. PUBG makes for dramatic viewing. It’s a battle royale style game where teams parachute on to an island and have to find weapons, grenades and bandages whilst fighting off other players, all while a destructive ring reduces the playable area or "safe zone". Teams are forced together, and the last team standing is the winner.
The project presented two challenges:
- Take complicated in-game data and turn it into an engaging AR based analysis graphic
- Take the same concept but now use a different graphics renderer and add some new features!
Challenge 1
Take complicated in-game data and turn it into an engaging AR based analysis graphic
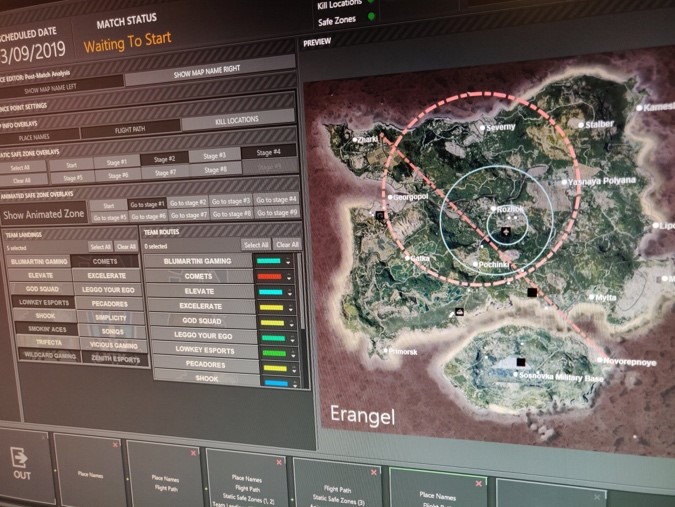
100 players and 25 teams with all their movement, kills, ammo and equipment available as real-time data.
In the chaos of the final circle, play is fast and furious.
But straight after the game it’s interesting to see the route and path of where winning teams have been and how they got there: but we can’t pause for too long because another game is about to begin.
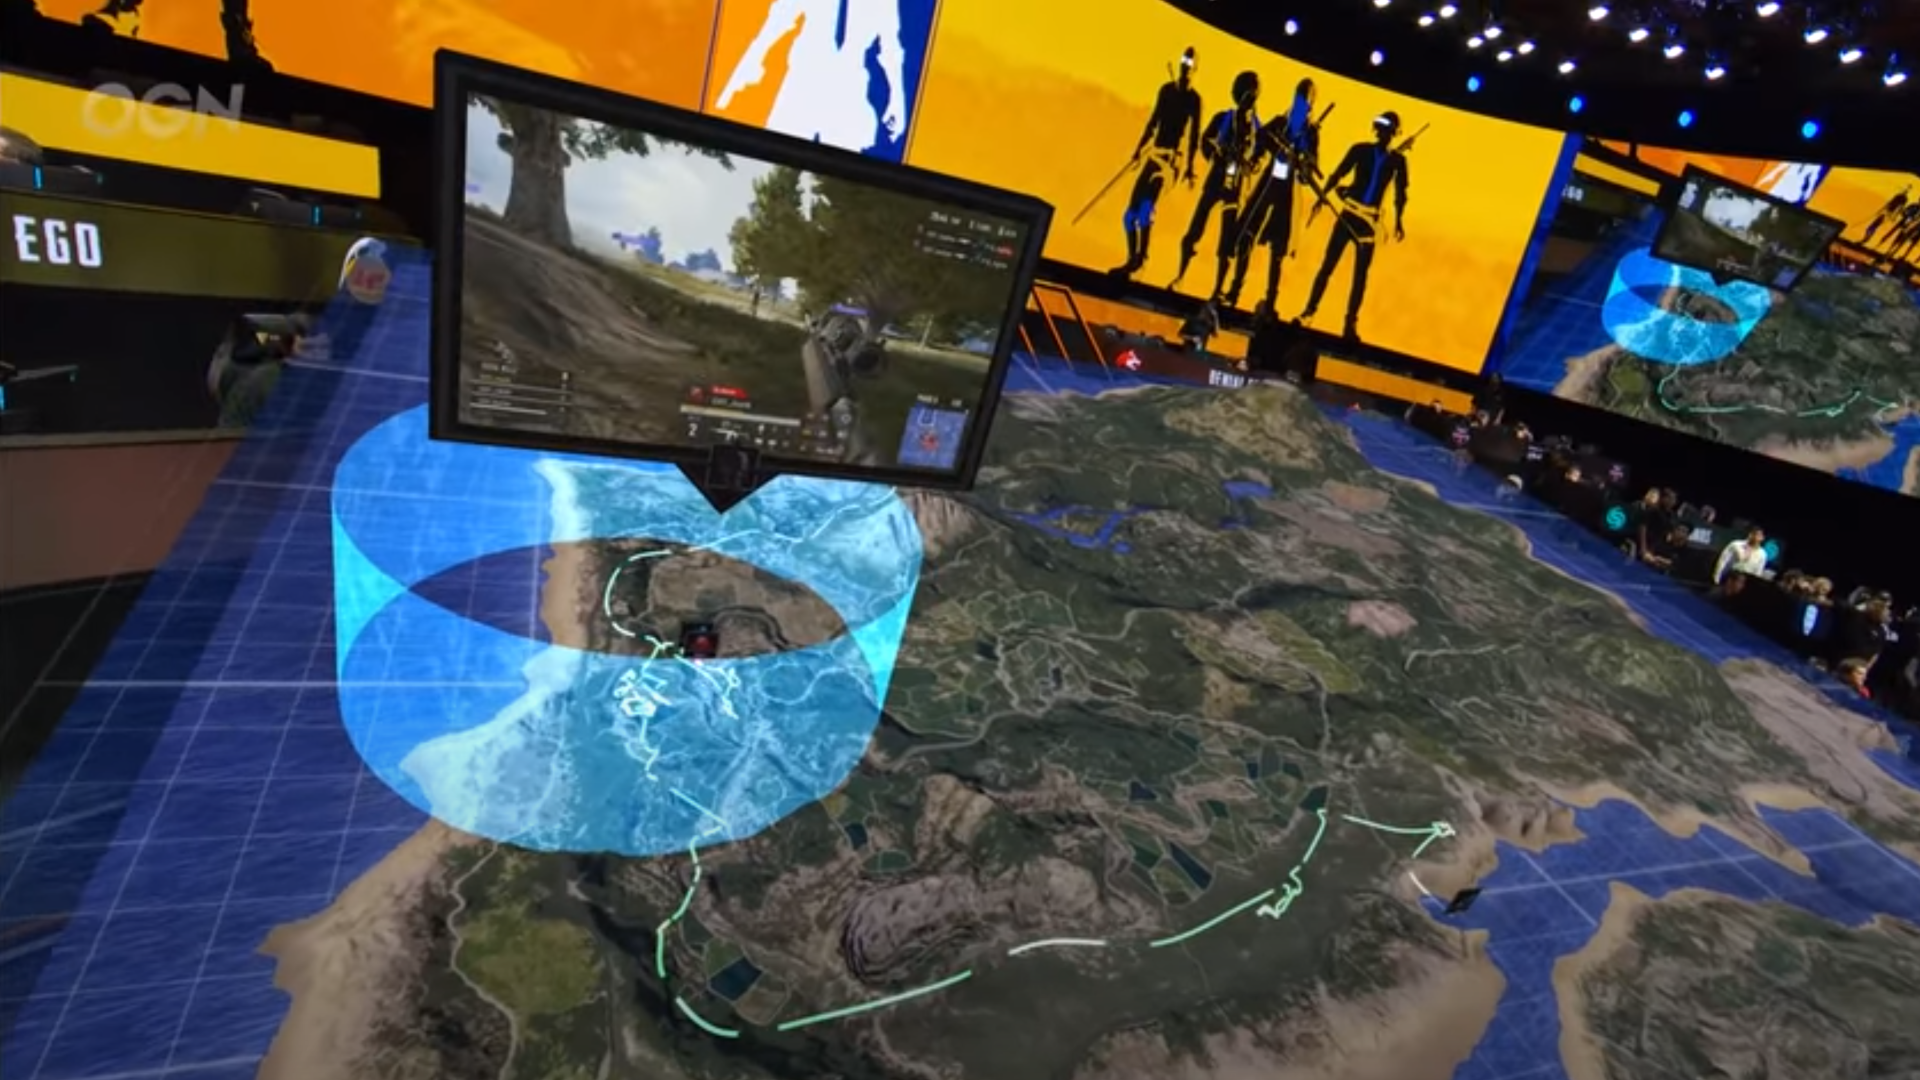
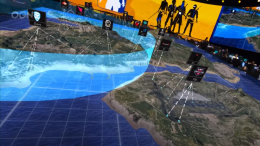
The client wanted the ability to see the whole map superimposed as a 3D AR object in their studio and be able to trace the movement of teams throughout the map whilst the presenter and players could talk the audience through the key moments.
Solution
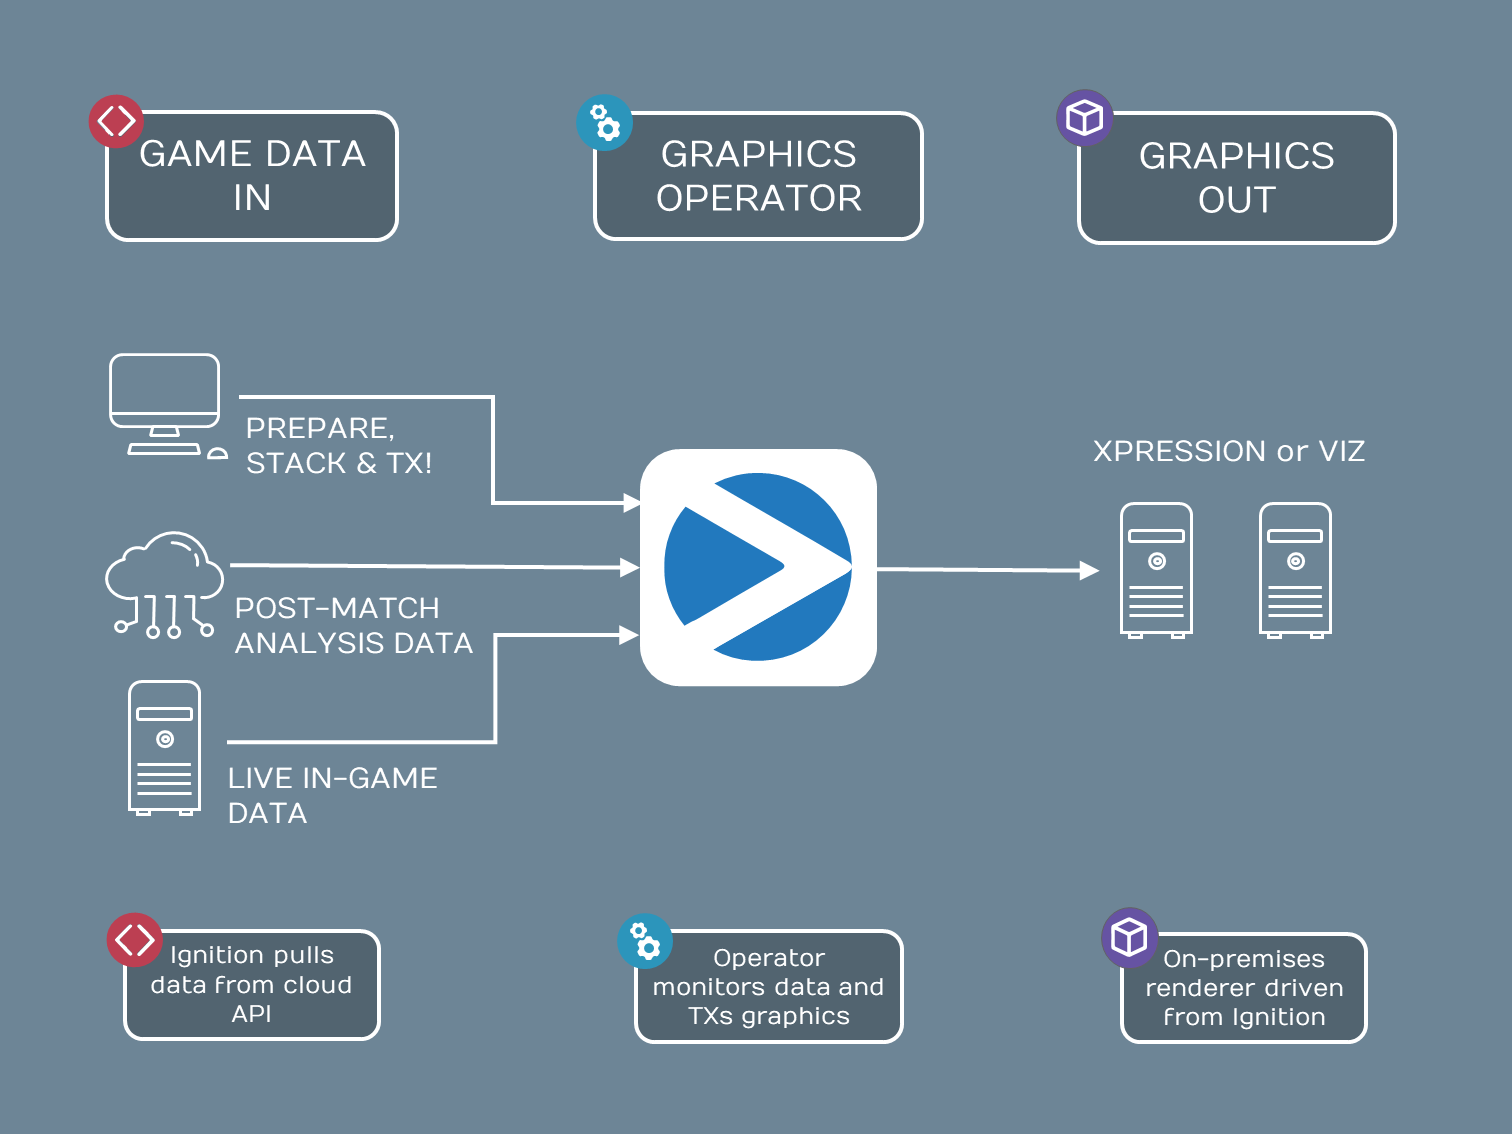
We took our Ignition framework and built a control system to allow operators to select the key moments and play through them on cue.
Data
Fanview provided an API from PUBGs data set in the form of JSON feeds on multiple HTTP endpoints. For this graphic we didn’t need to know every element of data (for example which player had which type of grenades, or which weapon they were using - all of which was available) but we did need relevant data for the graphic. This is where the original specification of the graphics functionality is so important. We worked closely with the client to understand the specification well, and to see how the technology could best tell the story.
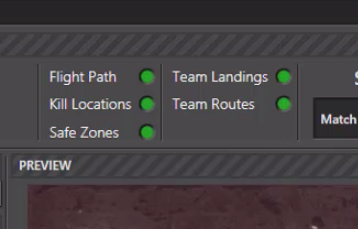
So, from the JSON endpoints we only took the data relevant to us:
- Flight path of the plane that drops the players
- Team routes & landing positions
- Position of the safe zone over time
- Location labels
- Kill positions
All of these would need to be presented with in-vision animations.
Graphics

Fanview provided a Cinema 4D file for the map which we imported to the chosen renderer, Ross Video’s XPression. From there we created all the necessary texture effects and 3D objects to create paths in real time.
Idonix added:
- Team markers
- Safe zone circles
- Team routes & animations
- Location labels
- Texture effects
- 3D splines to create the paths
- 3D model of the aeroplane (from a Cinema 4D file supplied by Fanview)
Scripting
A good deal of scripting was needed within XPression to create everything we needed. For example, placing the overlay objects such as kill locations, place names, flight paths and team routes and setting the data into each object. Setting the player images, team names and place names and triggering animations to make overlays animate in and out when needed: all done in VBScript.
Workflow
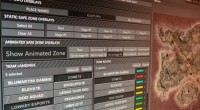
Availability of post-match had to be timely, so Ignition allowed them to cue up which teams they wanted to focus on. With the preview in Ignition they would step through and confirm their animations before playing them on air.
An operator could:
- Make a new sequence
- Choose to add place names
- Choose to add flight path & colour
- Choose to add safe zones & stages
- Select teams
- Add a pop-up video player at the final location with game play video from a live input
The interface gave data confidence monitoring, giving a red mark if anything was invalid or missing.
Once the sequence was prepared it was ready to play out to TX with confidence.
James Watton, developer at Idonix said ”This was one of our first XPression jobs and the biggest challenge was not having access to the hardware until the last minute. We didn't have any indication how far we could push XPression performance-wise and with a long feedback-cycle working with people in the US, we had to make it very flexible with the ability to turn on and off certain elements such as trees and buildings in case there were performance issues. In the end it looked great and performed brilliantly.”
James also notes that the challenges resulted in some extra features not originally planned: “Because we weren't in-studio and were working remotely in different time zones we added a lot of user-friendly settings in Ignition that would assist in setting up and configuring the map. Things like being able to move, scale and rotate the map to line it up with the physical set, and also to toggle on and off guides and markers, all without needing to touch XPression meant the client could do it themselves.”
Some months later came challenge number two:
Challenge 2
Take the same concept but now use a different graphics renderer and add some new features!
Stick with the same control interface, but rebuild the graphics on the new platform.
Data
Learning from the previous shows the client wanted to take advantage of the “in game time” data. This would allow them to recreate any moment from a match with a time stamp, moving to that position in the map for analysis. They wanted to see where and what each team was doing at any point in the game.
Graphics
At the client's request the graphics rendering was changed to Vizrt. This meant rebuilding the map and associated 3D objects and animations.
The map and the plane resources were Cinema 4D files so that part was easy - they could be directly imported - however the rest of the objects and animations had to be rebuilt. We used the cylinder primitive with a texture for the safe zones, and the Viz spline strip tool allowed our script to draw the team routes in real time.
Also, for the previous show they were only using two of the game maps - Erangel and Miramar. For this iteration Sanhok had to be added, so we had to import another map geometry. This map was half the width and half the height of the other two (thus four times smaller) so all the positions had to be scaled up because they wanted the map to take up the same amount of real space in the studio.
Scripting
Once again script was needed to achieve the complexity of animations and objects. The XPression script was ported to Viz script, adding the adding the time based functionality in the process.
In order to improve performance, we changed the way we sent data to the render engines. With XPression we were sending data every time the operator clicked live. This time Ignition calculated a timeline of events and created a Director in Viz with all the chosen teams points pre-loaded at the beginning of any sequence. This meant the data was sent once at the beginning rather than for each step. Now there was less chance of effecting performance whilst the graphics were in the middle of a camera move or animation.
If you do a lot of working in Viz Script you may find some of our tooling useful to help streamline your development processes.
Workflow
Ignition is renderer agnostic, so transferring that part of the tooling across took less than an hour. When operators sat down for the show they were presented with the very same interface they had used to drive XPression, but with added functionality around the “in game time” feature (the sequence builder was intelligent in that it wouldn’t let you add phase 2 after you’d added phase 3, but you could easily jump from phase 2 to phase 7).
Tom Chafer Cook, Senior Developer, said: “Working remotely on this project was a challenge. Little did we know how useful this experience would be in 2020! As we were not physically in the studio, we gave them as much flexibility as possible. For example, an Admin view that allowed them to set whether the logos faced the camera or not. Also, we built the plane to be the correct scale for the map but on TV it didn’t look great, so we provided the ability to scale the plane from our interface without them needing any Viz graphics expertise on site.”
Full forms and lower thirds
Both AR and on-screen
Before we wind up it’s worth pointing out that maps weren’t the only use for the AR: we also built match result graphics and leaderboards.
That’s not forgetting on-screen full form and lower third graphics, all driven from live data and the same Ignition control interface.
Conclusion
Having since worked on other eSports projects we’ve found that Ignition is perfectly suited for this genre, especially in the current climate of remote working and cloud support. Having this experience has helped us to tool for the new normal. Building graphics and testing them from a long distance has its challenges but can be done!
Key Learnings
- It’s not easy to transfer between two graphics systems – planning and rebuilding is required
- Data and control can be agnostic to the graphics if planned correctly
- The earlier in the process you are engaged, the more you can improve performance and functionality
- Having the same control interface regardless of graphics rendering technology is a massive benefit to the client’s workflows and productivity
What our friends say
Idonix deliver a quality product and always meet their deadlines - improving workflow and data managementSiena Dixon, Fanview