HTML Real-Time Graphics
UPDATE: Did you know we’re giving away the HTML scene we created in this article?
In this time of remote working not everyone may have access to sophisticated rendering technologies. Here at Idonix we decided to spend some time investigating how we can still deliver CG-style real-time graphics without the help of expensive hardware that may not be accessible at this time.
No Renderer? No Problem!
That’s where HTML comes in. If you’ve got a web browser, you’ve technically got a graphics renderer! Modern browsers on modern PCs have plenty of power to produce slick looking animations with the help of javascript and css:
Overlaying
There are plenty of ways to overlay web content onto video. We chose to try it out with OBS because a) it’s free, and b) there’s an NDI plugin that allows you to expose the OBS output as an NDI stream – we could then use the NDI Virtual Input tool to use the output as a webcam source and hey presto – overlay graphics on our Zoom/Skype/Teams meetings!
- You could also use these graphics in an HD-SDI workflow by using CasparCG's HTML producer.
What About Control?
If we have a web page containing graphics, how do we input the content, and then animate them in and out? To solve this problem we chose to use websockets with nodejs. It works like this:
- A node server serves up the graphics html pages.
- Javascript on the page listens for messages on a websocket channel.
- The node server also serves up ‘control’ web pages with all the relevant text boxes to fill in and buttons to click to automate the graphics.
- Javascript on these control pages sends a websocket message back to the node server, which then broadcasts that message to any graphics pages listening on the relevant channel.
With our OBS solution, we could then embed the control web page inside OBS using its Custom Browser Docks feature:
Scaling
To allow multiple instances of these graphics to be used simultaneously, we used the concept of channels. A graphics web page specifies what channel it is listening on by including it as a route parameter in its url – the control web page similarly specifies what channel it wants to broadcast to in its url. Our node server then knows what graphics pages to broadcast the control message to when it comes in.
This linkage allows multiple scenes to be served and driven simultaneously – all from the same ‘renderer’. Ultimate scaleability!
- Because the server is in the cloud, you can choose to have the control screen running on a different machine to the overlay, and even have one control screen broadcasting tx commands to multiple graphics overlays for added redundancy.
Scenes
We decided to split out each graphic into its own file. That way we can have an overarching ‘scene’ (web page) that includes all the relevant graphical elements you need within it. In this example we have a Locator, Dog, and NameStrap graphic, all sitting in our IdonixL3 scene.
The Main Controller
These scenes can handle the control messages any way they see fit. We decided to implement a version of our stateless main controller pattern (as used with Viz, XPression and Unreal Engine) – this way the control code doesn’t need to keep state and know whether it needs to call GoIn, Update or GoOut on a graphic: it simply defines all the graphics that should currently be on-screen, and what data they should contain. The main controller then enquires of each graphic in turn and determines what needs to be done to that graphic to get it into this new desired state.
- For a deep dive into our main controller logic, see this blog post.
Anatomy of an HTML graphic
We define our graphic as a javascript class that extends HTMLElement. That way we can define it as a custom element for our scene to use. It also allows us to define the html content for this graphic and set it on itself by using the innerHTML property.
This definition is contained in a single javascript file per graphic, then each graphic we want to use in a particular scene, we include in our main html file.
Here’s a look at everything contained within our custom graphic class:
State
A json object containing all the state information about our graphic – whether it has finished initialising (don’t try and animate me until I’ve finished initialising), whether it is in or not (useful for a main controller pattern to know whether to call GoIn or Update) etc.
Data
A subset of the State object: a nested json object representing the current data displayed on the graphic. This defines the schema of data to be sent to the graphic and is passed in on every GoIn and Update call. The new data passed in to the update method can be used to compare against the data currently stored on the graphic in order to work out what parts of the graphic need to change. For example, if the top line of a strap has stayed the same, but the bottom line has changed, the graphic only needs to animate the bottom line off then on again.
Template
The actual HTML model of the graphic. This is stored here, then used when the graphic is initialised to insert into the DOM.
Elements
We cache a list of all the HTML elements in our template for use later. This is useful for saving time in our animation methods by not having to query and find the elements we want to animate every time.
Timeline
We chose to use the Greensock Animation Platform to create our animations. This uses the concept of timelines - for our graphic we will have a top-level timeline object. Every GoIn, Update and GoOut call builds a sub-timeline and adds it to this main timeline. This allows the graphic to queue up all its animates if they come in too quickly because, by default, adding to a timeline places the new animation at the end of any existing animations on that timeline (this can be defeated by overriding existing animations if required too).
Go In, Go Out and Update Methods
Javascript functions that are called by a controller in order to animate this graphic. Each method builds a timeline and adds it to this graphic’s main timeline. The methods take data which is then compared against the graphic’s current state to determine what needs to happen in the animation.
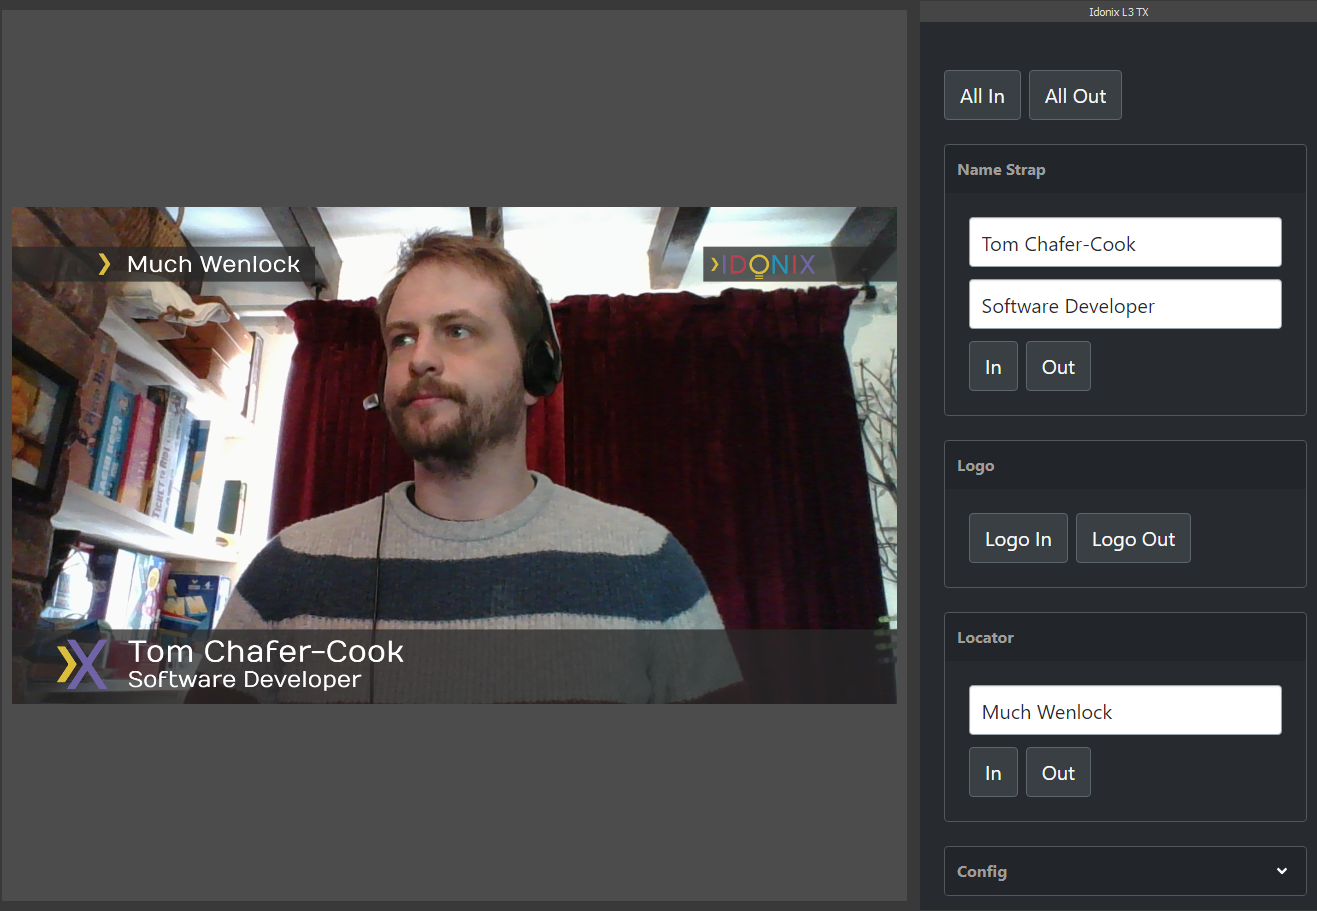
The Control Page
There’s not a lot to the control page really - this is how we approached it: