Behind the Scenes: Voyager Chart Plugin Promo
Idonix recently went to visit Ross Video’s demo studio in Reading to shoot a promotional video combining Ross technologies with Idonix’s Unreal Engine charting plugins for Voyager Virtual Studio. Here’s a quick dive into how we hooked up our plugins with data and automated them with Lucid Studio:
Voyager Virtual Studio
Idonix’s charting plugins can simply be dragged and dropped into any virtual studio environment created with Voyager. Once there, we can customise and style the plugins to match our theme.
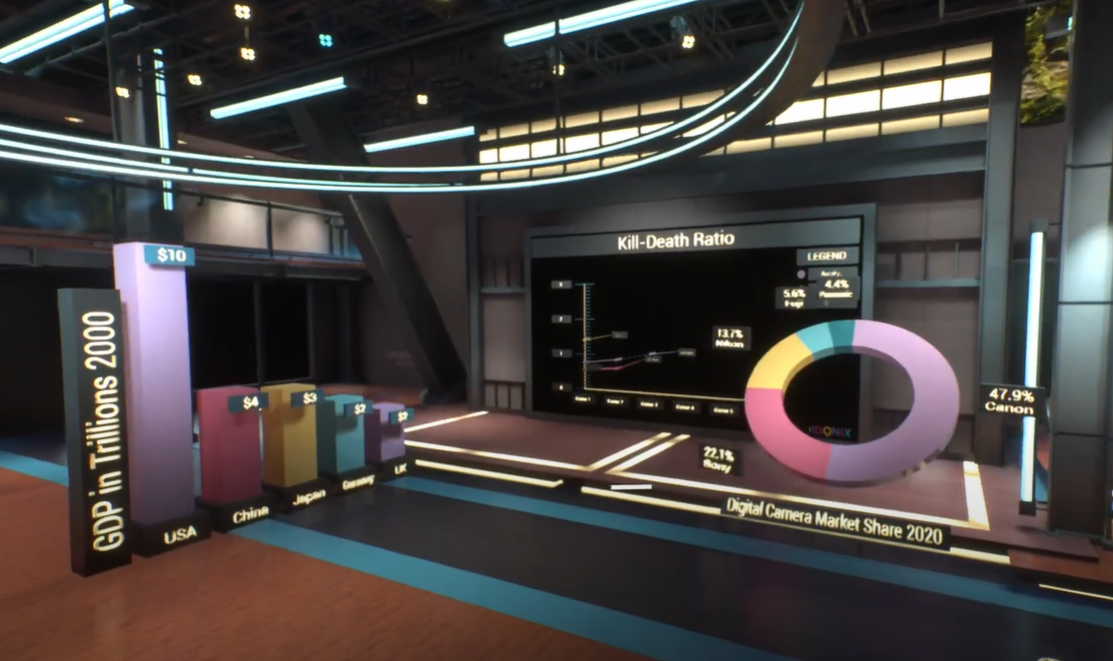
To control the set of charts that exist inside a virtual studio, you can either send your json data directly to each one (following our json schemas documented here), or you can send a json payload comprising the data for every plugin’s state simultaneously to our main controller plugin, which manages the corresponding ins and outs. That’s what we decided to use for this project.
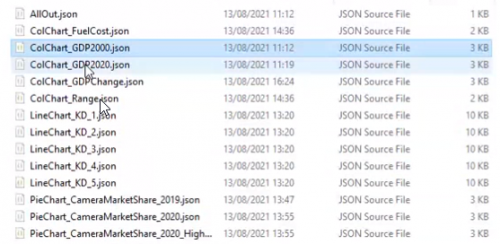
Static JSON Data
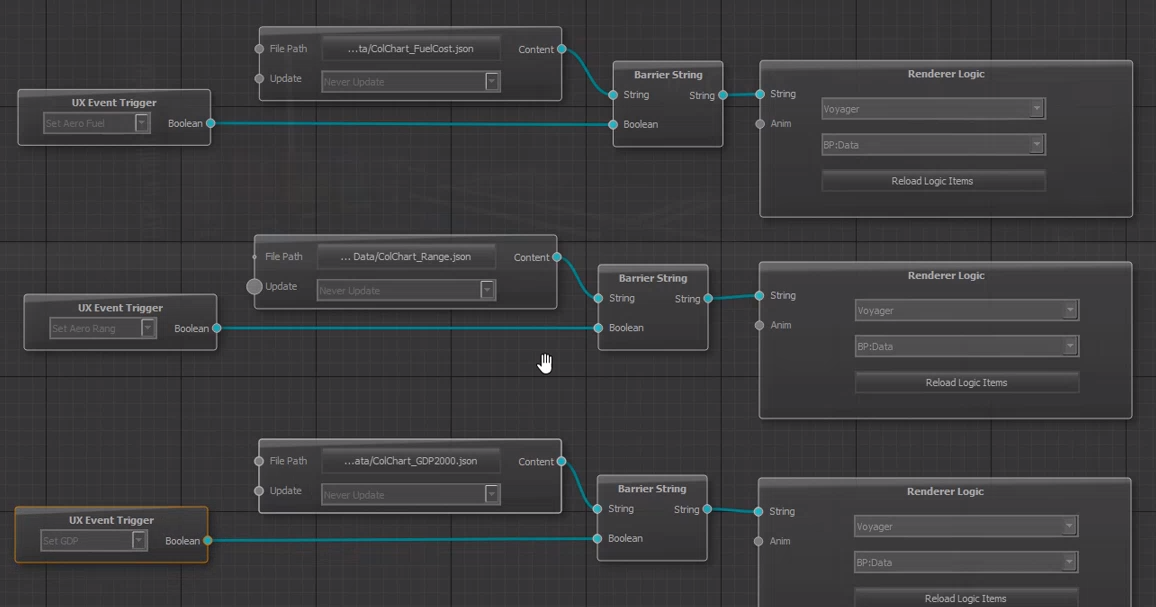
Because our sequence of data was pre-determined, we could generate a .json file for each step in the sequence, then read each file into our project on each button press from Lucid Studio.
Blueprints
To hook up our project to be controllable via Lucid Studio, we needed to configure some components in the Begin Play event of our Level Blueprint:
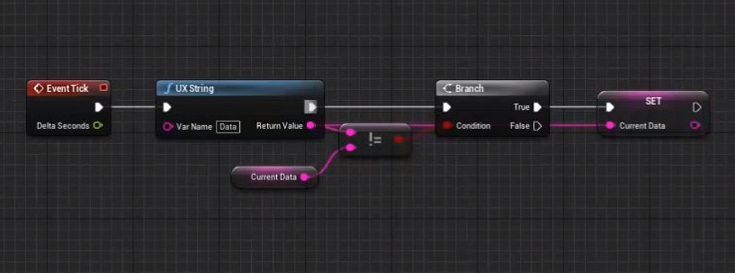
Lucid
We created a UX String node called “Data” that would be populated from Lucid Studio. We’d then be monitoring that string for changes and triggering our main controller whenever new data was present. Lucid Event Triggers would then read a particular json file and write the contents of that file to our Data string:
Alternatively...
There are many ways of getting data into our charting plugins. Because our sequence was pre-defined, we could build our json up-front, but you could also hook up Lucid Studio to live data by using DataLinq – then your Lucid buttons could pull the latest live data from Datalinq and populate a UX String node or trigger a UX Exec node to act on that data.
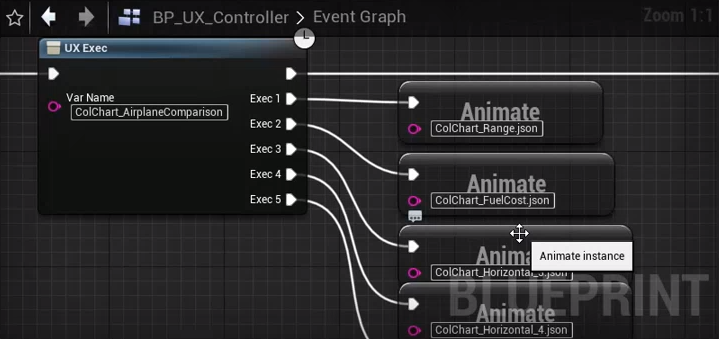
You could also create a UX Exec node for each graphic in your sequence, then trigger each node separately from Lucid Studio. This would mean the json reading would be done inside Voyager instead of Lucid Studio:
There is also Idonix’s UE Charting application that wraps up the json structures required and presents them via a data endpoint – then our own sequence building and editing tools can be used to prepare and play through data, triggering the same UX String functionality detailed above.